
For investors looking to find good opportunities, a mix of technical and fundamental analysis can be a useful tool. One particular plan involves looking for stocks that show both good business growth and financial soundness, along with positive technical patterns that hint at a possible price rise. This technique tries to locate firms with good fundamentals, like steady earnings growth and firm profitability, that are also forming on the price chart, possibly showing a meeting of better business speed and market notice. This article looks at ExlService Holdings Inc (NASDAQ:EXLS), a stock recently noted by such a filtering method.
ExlService Holdings Inc is an operations management and analytics company that offers data-led, AI-driven, and digital operations services in areas such as insurance, healthcare, banking, and capital markets. Based in New York, the company uses a global team to help clients enhance efficiency and decision-making.
Fundamental Strength: The Base of Growth
The fundamental argument for EXLS is strong, as covered in its detailed fundamental analysis report. The company gets an overall fundamental score of 8 out of 10, with especially high marks in Profitability and Financial Health, both at 9/10. This firm base is important for a growth investment, as it implies the company has the financial strength and operational effectiveness to continue its growth.
- High Profitability: EXLS shows excellent returns on capital. Its Return on Invested Capital (ROIC) of 17.72% and Return on Equity (ROE) of 27.50% put it in the leading group of its IT Services industry, doing better than over 90% and 89% of similar companies, in turn. Also, its profit margins have displayed steady gain over recent years.
- Firm Financial Health: With an Altman-Z score of 7.19 and a very workable Debt-to-Free-Cash-Flow ratio of 1.01, the company shows little chance of financial trouble. A good Current Ratio and Quick Ratio above 2.5 point to enough cash to handle short-term needs and pay for future growth.
- Continued and Expected Growth: EXLS displays a good history, with Earnings Per Share (EPS) increasing at an average yearly rate of 22.60% over recent years. While future growth is thought to slow, analysts still predict a solid yearly EPS growth of 14.57%, backed by expected revenue growth of over 12%.
These numbers fit well with the growth stock requirements, which stress companies doing better than their industry peers in earnings progress. EXLS’s high profitability and health scores supply the "acceptable profitability and health" filter needed by the plan, making sure the growth rests on a steady and effective operational foundation.
Valuation Setting
Even with its good growth and profitability, EXLS seems fairly priced. The company’s Valuation score is a neutral 6/10. Its Price-to-Earnings (P/E) ratio of 16.14 is priced lower than 62.5% of its industry peers and rests well under the present S&P 500 average. When growth is included through the PEG ratio, the pricing stays controlled. This mix of good growth at a fair price is often looked for by investors using a GARP (Growth at a Reasonable Price) method.
Technical Picture: A Pattern of Holding
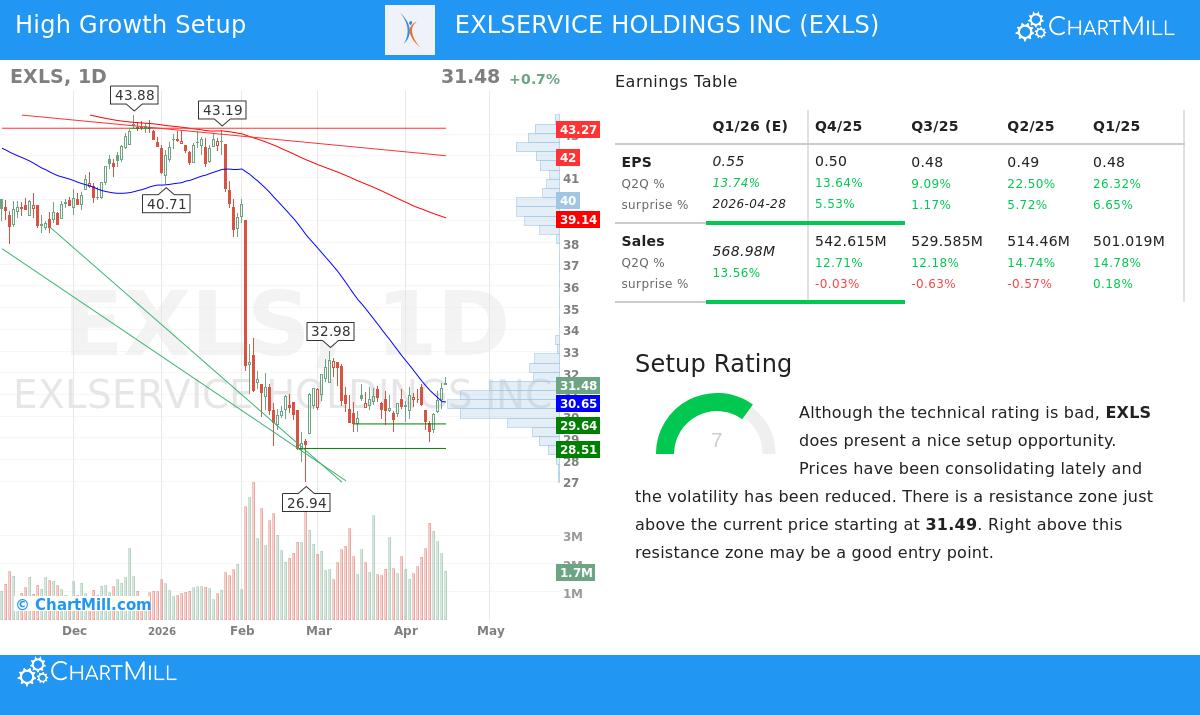
While the long-term direction for EXLS stays down, the recent technical view shows a possibly interesting turning point, as seen in its technical analysis report. The stock gets a low overall technical score of 1/10 because of its weak relative performance over the past year. However, it receives a more significant Setup Score of 7/10, which is the main filter used in the filtering plan.
- Holding in a Range: Over the past month, EXLS has been trading in a set range between about $28.82 and $31.78. It is now trading close to the top of this range, showing a test of near-term resistance.
- Important Resistance Level: A major resistance area is found just above the present price, beginning at $31.49. This area is made by a mix of horizontal price levels and moving averages across different time frames.
- Setup Reading: The plan finds an "acceptable setup pattern" marked by lower volatility and price holding. The idea is that a clear move above the noted resistance area ($31.49) could point to a change in speed, possibly giving a technical entry point. This pattern is what the filter looks for: stocks with good fundamentals that are tightening technically, hinting at building pressure for a next step.
Summary and Plan Combination
ExlService Holdings Inc shows a situation where firm fundamental growth measures meet a technical chart pattern hinting at a possible price rise. The filtering plan that found EXLS specifically searches for this meeting: good, profitable growth companies that are not just declining but are instead forming positive bases on their charts. The high Growth, Profitability, and Health fundamental scores confirm the quality of the business, while the higher Setup Score points out the technical chance.
It is key to remember that a move above resistance is not certain, and the overall market direction, with the S&P 500's short-term trend now neutral, adds a level of setting. Investors should view such technical signs as part of a wider study that includes risk control.
Interested in finding other stocks that fit this mix of good growth fundamentals and positive technical pictures? You can use the same filter with our stock screener here.
Disclaimer: This article is for information and learning only and does not make investment advice, a suggestion, or an offer or request to buy or sell any securities. The study shown is based on data and reports thought to be dependable, but its correctness cannot be sure. Investing in stocks includes risk, including the possible loss of main amount. You should do your own research and talk with a qualified financial advisor before making any investment choices.