
For technical investors looking to find stocks ready for their next rise, a frequent method uses two main parts: a solid core trend and a time of price stability that gives a visible entry point. This method tries to seize momentum by buying a stock as it moves above a set trading band, with the earlier upward trend hinting at the chance for more gains. An organized way to locate these chances is by searching for stocks that show both a high technical condition score and a high setup condition rating, which together point to a sound trend and a helpful halt inside it.
Technical Strength: A Base of Momentum
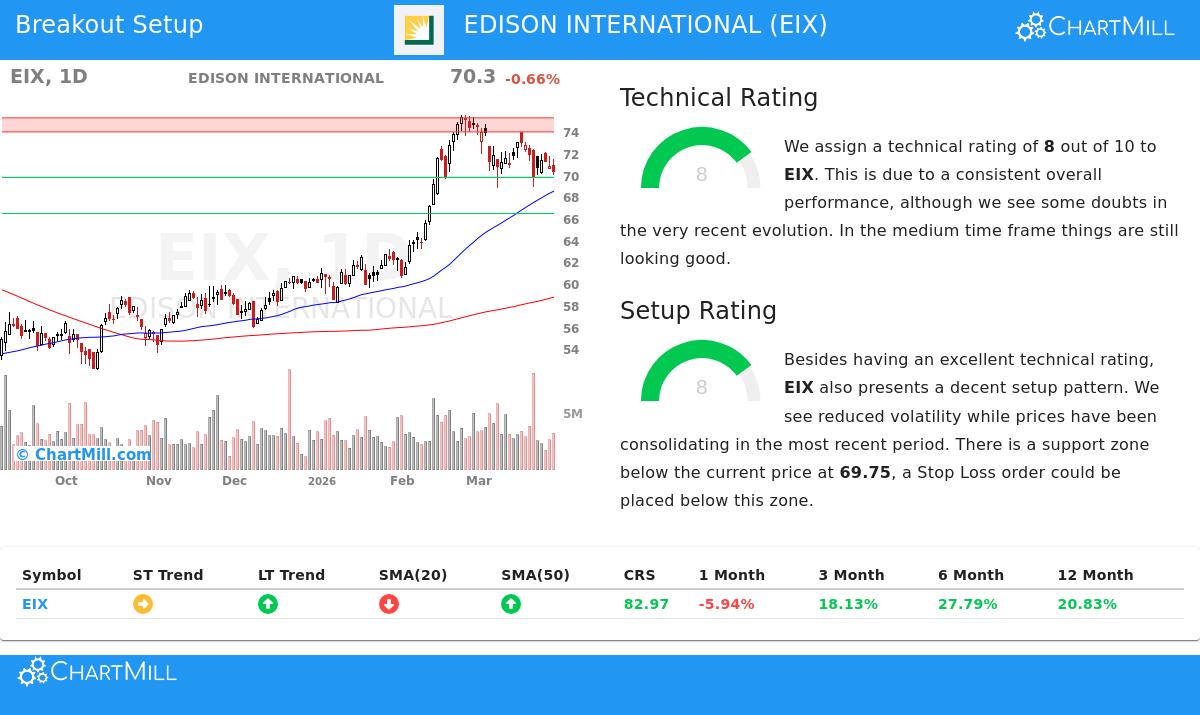
The first part of this breakout method is finding stocks with good technical condition, which shows a lasting and firm uptrend. EDISON INTERNATIONAL (NYSE:EIX) shows this trait clearly. Based on its ChartMill Technical Analysis report, the utility company gets a sound Technical Rating of 8 out of 10. This number comes from a review of several items, like relative strength, moving averages, and long-term trend direction.
The data points to this technical condition:
- Long-Term Trend: The long-term trend for EIX is labeled positive, a key base for any breakout candidate.
- Relative Performance: In the last year, EIX has done better than 82% of all stocks in the market and 78% of its group in the Electric Utilities industry.
- Moving Average Alignment: The stock is priced above its important rising moving averages (50-day, 100-day, and 200-day), confirming the upward structure. Its present price close to the high point of its 52-week band adds to this positive view.
This high technical rating is needed for the method because it sorts for market front-runners and stocks with momentum, raising the chance that a breakout will continue instead of fading fast.
Setup Quality: The Stability Before the Change
A solid trend by itself is not a buy sign; buying a stretched stock can be dangerous. The second key part is a good-quality setup, which finds a time of stability or a narrowing price band. This makes a possible base from which the next breakout can start. EIX also rates well here, with a Setup Rating of 8. This rating looks at items like nearness to moving averages, recent price tightness, and the existence of clear support levels.
The technical report notes the helpful setup pattern:
- Recent Trading Band: In the last month, EIX has traded between $68.77 and $74.74. It is now placed in the middle of this band, showing a halt in the earlier climb.
- Clear Support: The review finds an important support area at $69.75, made by a mix of trendlines. A defined support level is key as it gives a logical place to set a protective stop-loss order.
- Lowered Volatility: The report states that price movement has lessened recently, a common trait of a stability phase where supply and demand find a short-term balance.
This high setup score answers the "when" to buy by marking a moment where the stock is not overstretched. It implies the stock is tightening, possibly getting set for a clear move, and gives a tactical entry point with a controlled level of risk set by the close support.
Possible Trade Details
From this joined review of trend and setup, the technical report proposes a possible trading plan. It describes an entry point just above a short-term moving average at $71.45, with a stop-loss set below the found support area at $69.74. This would cap the example risk on the trade to about 2.4%. It is key to see this is an example made from the technical pattern; investors must always do their own review and adjust any trade to their personal risk comfort and method.
Finding More Breakout Chances
The search process that found EDISON INTERNATIONAL can be used each day to find new possible setups in the market. By concentrating on stocks with both high technical and setup ratings, investors can methodically filter for chances where solid momentum may be starting again after a halt.
For investors wanting to see the present list of stocks fitting these technical breakout rules, the search is here: View Today's Technical Breakout Setups.
Disclaimer: This article is for information only and is not investment advice, a suggestion, or a deal to buy or sell any security. The review uses technical data and automatic scoring models, which have limits. Past results do not show future outcomes. Investors should always do their own research, think about their money situation and risk comfort, and talk with a qualified money advisor before making any investment choices.