
For investors aiming to achieve notable price gains, a method that joins sound core business traits with positive stock price movement can be especially persuasive. One such tactic is to search for stocks displaying strong expansion, good fiscal condition, and earnings, while also demonstrating chart patterns that suggest a price advance. This technique seeks to find firms that are not only increasing their profits and sales faster than normal but are also starting to gain more attention from buyers, possibly marking the beginning of a new rising phase. By merging these measurable fundamental checks with chart study, investors can seek chances where a firm's good operational narrative is being supported by its share price activity.
DexCom Inc. (NASDAQ:DXCM) serves as an example for this investment method. As a top firm in continuous glucose monitoring (CGM) systems, the company works in the big and increasing diabetes care sector. An examination of its basic and chart-based picture indicates it fits the standards of a solid expansion stock displaying evidence of a chart formation.
Basic Power: The Expansion Driver
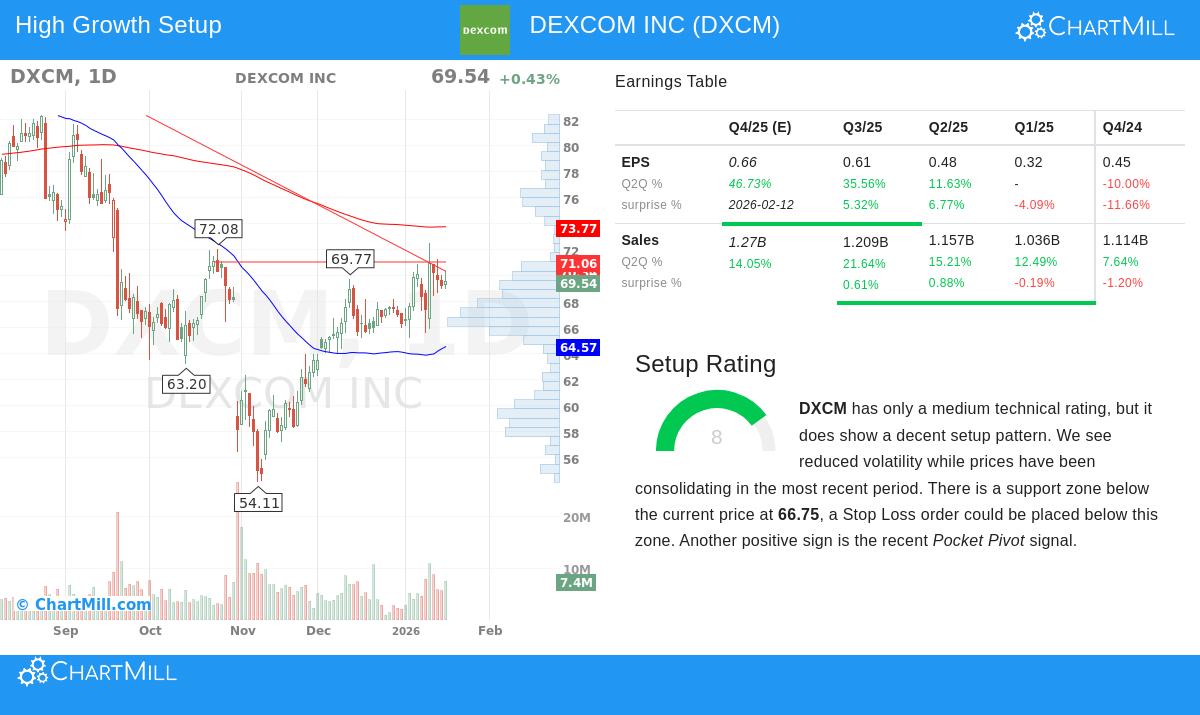
The foundation of this method is finding companies with outstanding and lasting expansion. DexCom's basic report, which you can examine fully here, points to a business performing very well from an operational view. The company receives a high Expansion Score of 8 out of 10, backed by notable past and expected growth.
- Past Expansion: In recent years, DexCom has shown excellent results, with Sales increasing at a typical yearly speed of 22.27% and Earnings Per Share (EPS) rising by 29.25% on average.
- Future Predictions: Experts project this pace to persist, with EPS predicted to grow above 22% each year and Sales expected to rise by more than 13% on average in the next few years.
This steady, double-digit expansion is key for an "expansion stock" label, as described in our opening explanation. Investors look for such companies mainly for their chance to outperform industry counterparts and the wider market, targeting price gains. Also, DexCom adds to its expansion with top-level earnings power, getting a first-class Earnings Score of 9. Its Return on Equity (26.44%) and Earnings Margin (15.96%) place in the highest 10% of its field, showing it turns revenue into profit effectively. A good Condition Score of 7 shows a reasonable debt level and sound overall fiscal stability, giving a firm base for ongoing growth.
Chart Formation: A Sign from the Market
While sound basics are necessary, the chart study shows if the market is starting to acknowledge and value this strength. DexCom's chart report, found here, mentions a Formation Score of 8, meaning a positive pattern is forming even with a medium total chart score.
Important chart notes include:
- Direction Change: The near-term price direction has lately become positive, hinting the stock is earning favor from traders and investors.
- Bull Flag Shape: The price movement is now forming a bull flag shape. This is a pause pattern that usually happens after a sharp rise, possibly giving a planned entry chance during a new upward direction.
- Floor and Speed: The stock is priced above a clear floor area, and recent sessions have shown a marked rise in trade activity during up moves—an indication of big buyer interest often called a "Pocket Pivot."
This chart view is important for the joined method. It shifts the study past just finding a sound company to finding a sound company whose shares might be at a turning point. The breakout pattern implies that the time of pause or lower prices could be finishing, matching the stock's price path with its positive business basics.
Price Consideration
No study is whole without looking at cost. DexCom's Price Score is a middle 5. Its Price-to-Earnings (P/E) ratio seems high in simple terms but is actually priced lower than most of its industry competitors. Most significantly, the PEG ratio, which changes the P/E for expansion, points to a fair price given the firm's high predicted profit expansion speed. For expansion investors, a higher price can sometimes be acceptable due to better and lasting growth, which DexCom has regularly shown.
A Merging Chance
DexCom Inc. shows the kind of chance a joined basic and chart search tries to find. The company has the clear traits of a standard expansion stock: a big target market (the worldwide diabetes population), major expansion possibility as CGM use grows, and a top market position held by new ideas. By the numbers, this is verified by excellent expansion speeds, high earnings power, and good fiscal condition.
Now, the chart study suggests the market might be ready to revalue the stock. The appearance of a bull flag shape and a positive near-term direction change could mean a new period of price gain is starting, possibly giving a well-timed entry point for investors who trust the long-term expansion story.
Interested in finding other stocks that fit this method of solid expansion joined with positive chart formations? You can use the same search with our stock screener here.
Disclaimer: This article is for information only and is not financial guidance, a suggestion, or a bid to buy or sell any securities. The content is based on supplied data and should not be the only source for any investment choice. Investing holds risk, including the chance of losing the original amount. Always do your own research and think about talking with a registered financial consultant before making any investment choices.