
For technical investors, identifying stocks with both solid fundamental momentum and a distinct, practical entry point is a foundation of a disciplined method. One structured path involves looking for stocks that show a high "Technical Rating," pointing to good long-term condition and trend durability, paired with a high "Setup Quality Rating," which indicates a helpful consolidation shape ready for a possible breakout. This process separates stocks that are only trending from those that are trending and also set for a new phase of increase, trying to capture moves as they start instead of following stretched price movement.
Darling Ingredients Inc (NYSE:DAR) recently appeared from such a screening process, presenting an interesting profile for traders concentrated on technical patterns. The company, a global producer of natural ingredients from renewable sources, is in a technically favorable position as the market assesses trends in sustainable food and fuel.
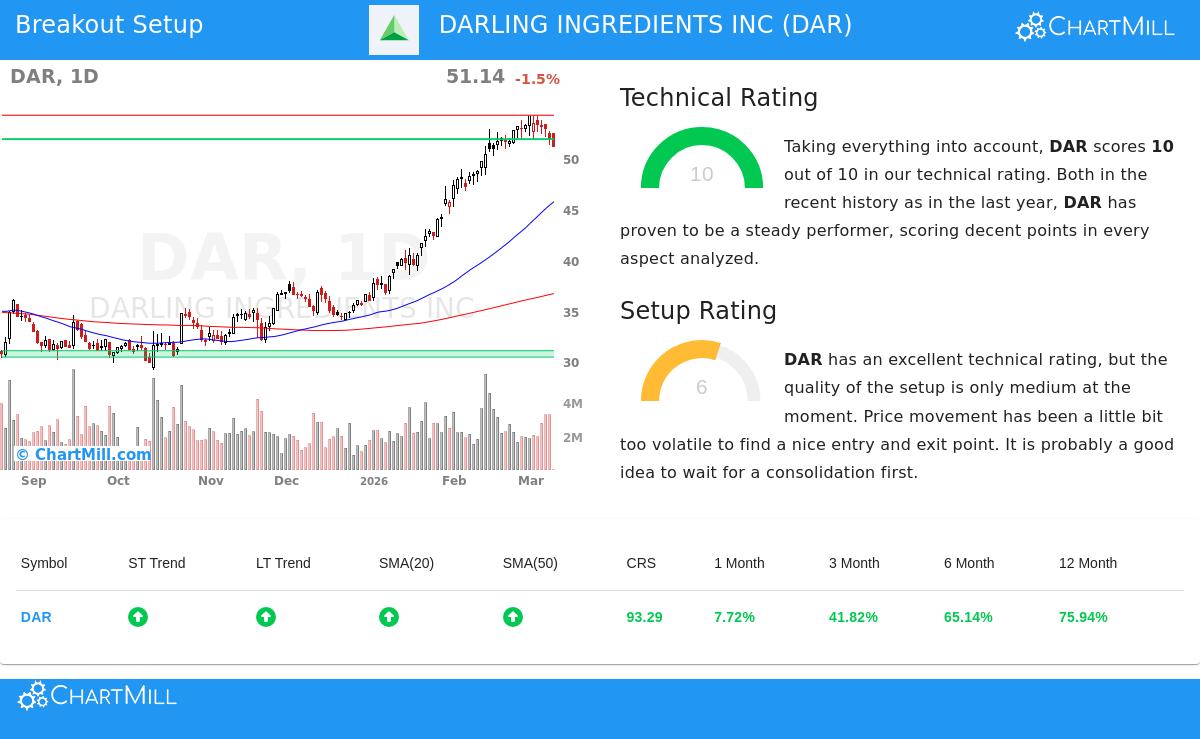
Technical Strength: A High-Level Rating
The base of any breakout candidate is a durable and confirmed uptrend, and Darling Ingredients does very well here. The stock’s ChartMill Technical Rating is a full 10 out of 10, putting it with the market front-runners from a technical view. This high score is not given without reason; it shows very good performance across many time periods and measures.
- Trend Agreement: Both the near-term and longer-term trends for DAR are labeled positive. This agreement across different time frames is a strong sign of continued buying interest and lessens the distraction of opposing signals.
- Relative Performance: The stock is doing better than 93% of the whole market over the last year, and it beats 94% of similar companies in the Food Products industry. This shows that its durability is specific to the stock and not just a result of a rising sector or market.
- Moving Average Backing: DAR is trading above all its main simple moving averages (20, 50, 100, and 200-day), and each of these averages is itself in an upward arrangement. This forms a tiered support structure below the price.
- Nearness to Highs: The stock is now trading close to its 52-week high of $54.24, confirming the durability of the current trend. The analysis states this performance matches the wider market, which is also near highs, implying the move is shared rather than unusual.
This very good technical condition, explained in the full technical report, is key for the breakout plan. A high Technical Rating makes sure an investor is placing a bet aligned with the main market force, greatly bettering the chance that a breakout will lead to a continued rise instead of a false alert.
Setup Quality: Reviewing the Entry Point
While a durable trend is needed, it is not enough for a best entry. A stock can be technically very good but stretched, leaving a trader open to a quick decline. This is where the Setup Quality Rating becomes important, as it reviews the stock’s recent price movement for consolidation and lower-risk entry areas.
For DAR, the Setup Rating is now a 6. The analysis summary states that while the technicals are "excellent," the setup quality is "only medium at the moment." The report says that "price movement has been a little bit too volatile to find a nice entry and exit point," indicating some unevenness in the recent consolidation.
- The Shape: Despite the average setup score, the report finds that DAR "is currently showing a bull flag pattern." This is a standard continuation shape where prices decline modestly in a tight range after a strong upward move, often coming before a return to the trend.
- Support and Resistance: Important levels are clearly marked. A major support area is found between $30.42 and $31.05. More directly, resistance is seen near $51.82-$51.91 (from moving averages and trendlines) and again at $54.21. The present price around $51.14 puts it just below this first resistance zone.
- Automated Setup Idea: Based on its analysis, the system proposes a possible trade with an entry at $53.09 (a buy-stop above the 20-day moving average) and a stop-loss at $51.81 (below the nearby support). It notably warns that the space between this entry and exit is fairly small compared to the stock’s average daily movement, suggesting traders check if improved points can be located.
The average setup score is a note that not every good stock offers a clean, low-volatility entry at all times. For some traders, the existence of the bull flag pattern and clear resistance levels may give enough form to plan a trade, possibly with a broader stop to accommodate the noted volatility. For others, the score suggests waiting, looking for a tighter, better-quality consolidation to develop before committing funds.
Conclusion
Darling Ingredients shows a split technical view: almost perfect long-term durability paired with a present setup that needs thoughtful handling. For technical investors, this shows both a chance and a warning. The chance exists in the stock’s confirmed market leadership and its place in a helpful bull flag pattern just below set resistance. The warning is contained in the setup score, which argues against a hurried entry and points out the need for exact risk control due to recent price swings.
The central method of pairing a high Technical Rating with a high Setup Rating is made to find the best meeting of trend and timing. DAR shows the first part of this condition completely. The second part—the perfect timing—may need either a more patient wait for a calmer pattern or a carefully placed trade that acknowledges the stock’s present volatility.
Interested in finding other stocks that fit similar technical and setup conditions? You can find new breakout setups each day by using the Technical Breakout Setups screen.
Disclaimer: This article is for informational purposes only and does not constitute financial advice, a recommendation, or an offer or solicitation to buy or sell any securities. The analysis is based on technical data and automated scoring models, which are subject to change. Investing involves risk, including the potential loss of principal. Always conduct your own research and consider your individual financial situation and risk tolerance before making any investment decisions. The automated trade setup mentioned is an example and should not be interpreted as a specific recommendation.