
In the search for stocks with the possibility for major growth, many investors use systematic methods that mix strict technical and fundamental study. One well-known method is the strategy made famous by Mark Minervini, a two-time U.S. Investing Champion. This method depends on the "Trend Template," a group of technical rules made to find stocks in strong, confirmed uptrends. It is then combined with fundamental filters to confirm the basic company shows the firm and quickening earnings and sales growth typical of market leaders. This joined filter seeks to locate securities that are not only technically good but also fundamentally set for more growth, making them possibilities for high-growth momentum investing.
Technical Base: Following the Minervini Trend Template
The first part of this strategy is confirming a stock's price movement shows clear, multi-timeframe force. CHENIERE ENERGY PARTNERS LP (NYSE:CQP) now shows a chart that matches the main ideas of the Minervini Trend Template. This template is important because it filters for stocks already in a verified "Stage 2" uptrend, steering clear of the problems of trying to catch a falling knife or buy into a fading trend.
A look at CQP's main numbers shows it fits the template's strict technical list:
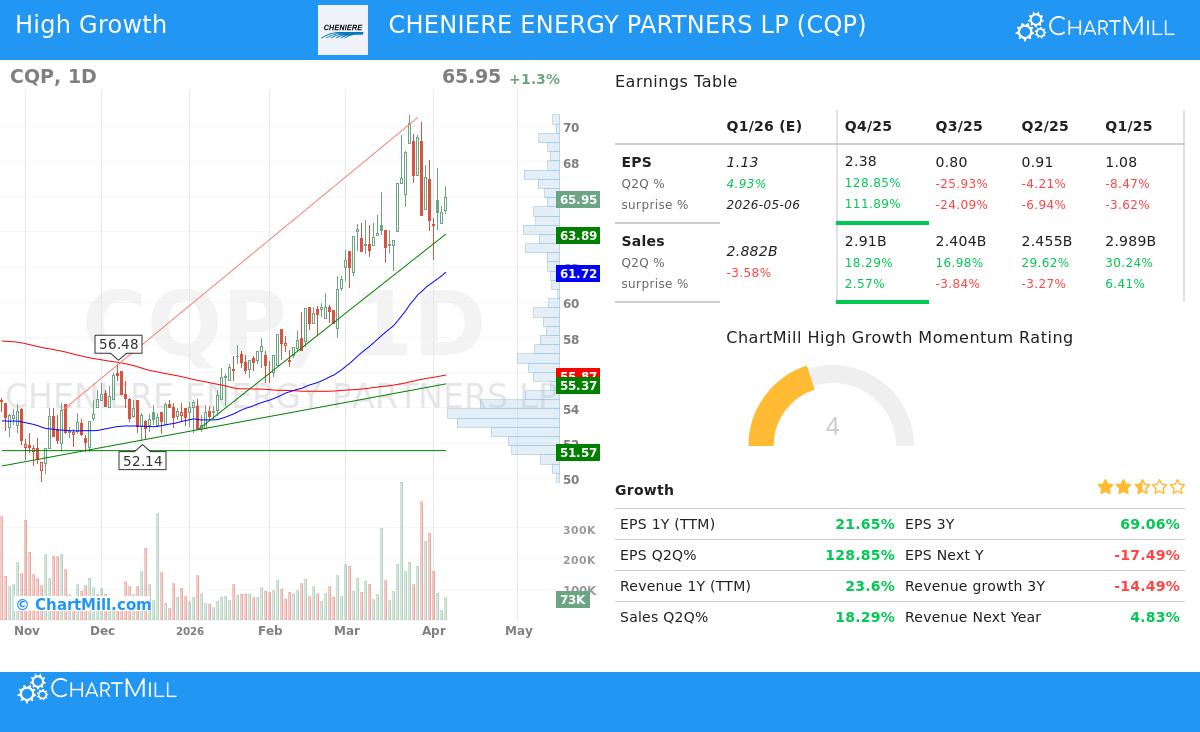
- Trend Position: The stock is trading above its rising 50-day, 150-day, and 200-day simple moving averages (SMAs). Importantly, the 50-day SMA ($61.72) is above the 150-day SMA ($56.18), which is then above the 200-day SMA ($55.87). This order of shorter-term averages above longer-term ones is a classic sign of maintained upward momentum.
- Nearness to Highs: CQP's last price of $65.95 is about 33% above its 52-week low of $49.53 and within 7% of its 52-week high of $70.64. Minervini's strategy focuses on buying strength, not weakness, preferring stocks that are already showing leadership by trading close to new highs.
- Relative Strength: With a ChartMill Relative Strength (CRS) ranking of 75.45, CQP is doing better than a large part of the wider market. While the perfect target is often above 80, a ranking above 70 still shows good relative performance, a main filter for finding sector leaders before they make their biggest moves.
This technical setup points to institutional buying and a small chance of the stock being in a long drop, giving a good background for more growth.
Fundamental Driver: Meeting Standards for High Growth Momentum
A forceful chart is only part of the story. The Minervini strategy fully mixes fundamental study to find companies with quickening business results. The "High Growth Momentum" (HGM) rating is made to catch this, and CQP's fundamental data shows several strong growth points.
- Firm Earnings Growth: The company's trailing twelve-month (TTM) Earnings Per Share (EPS) is at $5.17, showing a year-over-year growth of 21.6%. More notably, the most recent quarterly EPS jumped 128.8% compared to the same quarter last year. This type of fast quarterly earnings speed is just what the strategy looks for, as it often draws institutional notice and can start more price gains.
- Forceful Revenue Growth: Top-line growth is also clear, with TTM revenue up 23.6% year-over-year. The latest quarter saw sales grow by 18.3%. Steady revenue growth gives a firm base for earnings and signals rising demand for the company's services.
- Good Profitability: The company keeps strong profit margins, with the last reported quarter showing a net profit margin of 39.6%. High and growing margins are a sign of efficient, scalable businesses and add directly to bottom-line growth.
While there are mixed signs in the data, such as a recent slowing in analyst guesses for next year's EPS and revenue, the core past growth numbers in earnings and sales are clear. This fundamental momentum, when joined with the stock's positive technical state, makes the combined setup the joined screen is made to find.
Technical Condition and Setup Review
Beyond the exact Trend Template filters, a wider technical study of CQP supports its present force. According to ChartMill's own report, the stock gets a good Technical Rating of 8 out of 10, pointing to very healthy technicals across short and long-term timeframes. Both the short-term and long-term trends are rated as positive, a solid sign for continuation.
Also, the report gives CQP a Setup Rating of 8, pointing out that the stock is now in a consolidation phase within its uptrend. The study notes that prices have been trading in a range between about $61.76 and $70.64 over the past month, with lower volatility. This type of orderly pullback or pause, often called a "volatility contraction," can offer a possible entry chance for investors waiting for a new momentum push. The report finds clear support and resistance areas, giving logical levels for planned stop-loss placement and profit goals.
For a full breakdown of the support/resistance levels and the automated trade setup idea, you can see the full ChartMill Technical Analysis Report for CQP.
Conclusion
CHENIERE ENERGY PARTNERS LP (CQP) shows an example in how the Minervini-inspired, high-growth momentum screen works. The stock successfully meets the technical checks of the Trend Template, confirming it is in a set uptrend with positive relative strength. At the same time, its fundamental profile shows the type of forceful earnings and sales speed that supports maintained market outperformance. The meeting of these technical and fundamental points suggests CQP may be placed as a leader in its sector.
It is key to recall that screening is the first stage. Any possible investment needs more individual research, including a review of the wider market conditions, sector forces, and company-specific news or events.
Interested in finding other stocks that fit this strict growth-and-trend model? You can look at present choices by using the High Growth Momentum + Trend Template screen on ChartMill.
,
Disclaimer: This article is for informational and educational purposes only. It is not intended as investment advice, a recommendation, or an offer to buy or sell any security. The analysis is based on data provided and certain methodological frameworks, but past performance is not indicative of future results. Always conduct your own research and consider consulting with a qualified financial advisor before making any investment decisions. Please read our full disclaimer here.