
In the search for returns that exceed the market, many investors use systematic plans that join strict technical study with basic growth measures. One method, made famous by noted trader Mark Minervini, centers on finding stocks already in strong upward moves, those showing firm price momentum and institutional backing, while also requiring sound basic business growth. This two-part filtering process aims to catch leading stocks early in their main price climbs. A stock that meets both the technical "Trend Template" and strict growth checks makes a strong argument for investors focused on momentum and growth.
CODA OCTOPUS GROUP INC (NASDAQ:CODA) recently appeared through a filter process made to locate such possibilities. The filter uses Minervini's Trend Template to confirm a stock is in a clear, long-term upward move, and adds a "High Growth Momentum" score to check the company's basic expansion is speeding up. This pairing tries to sort for securities where firm price movement is supported by getting better business results, a key feature of Minervini's SEPA (Specific Entry Point Analysis) plan.
Technical Health: Matching the Minervini Trend Template
The center of Minervini's technical method is his Trend Template, a group of fixed rules made to find stocks in a Stage 2 climb. CODA seems to satisfy these important conditions, which are needed for confirming continued institutional buying and a lower-risk trend setting.
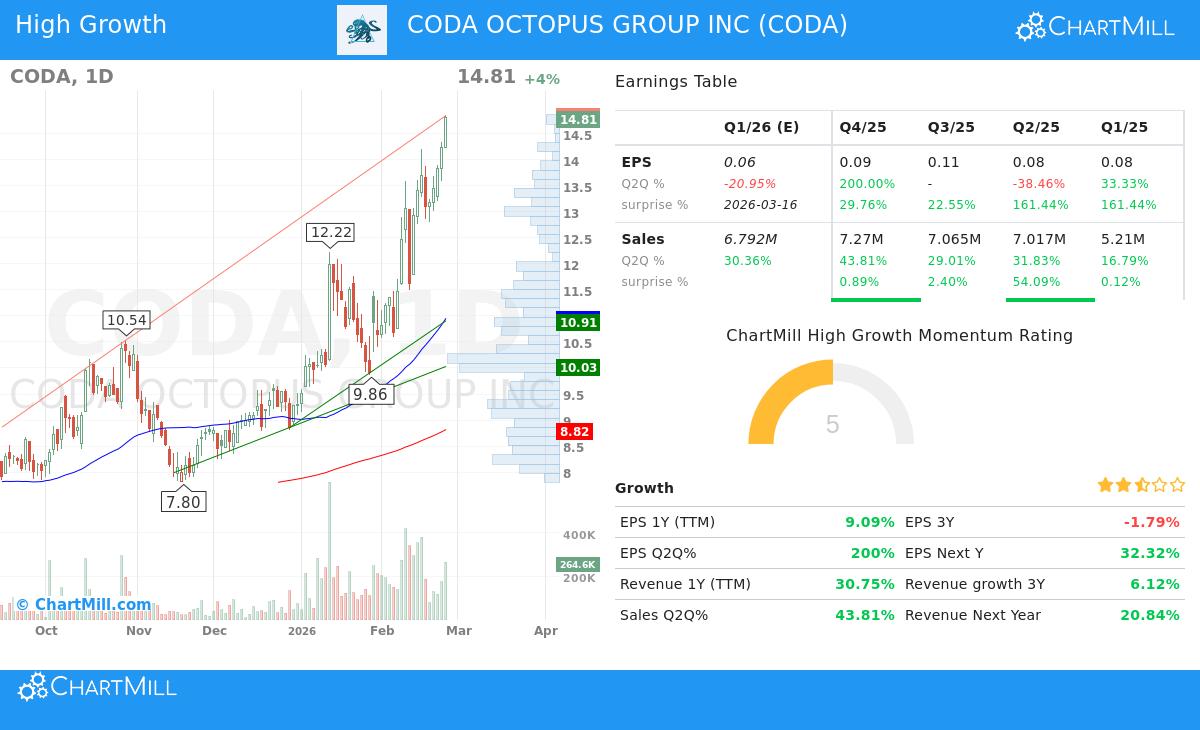
- Price Above Important Moving Averages: The stock's last price of $14.81 trades well above its rising 50-day ($10.95), 150-day ($9.26), and 200-day ($8.82) simple moving averages (SMAs). This order shows the stock is in a clear uptrend across all main timeframes.
- Moving Average Order: The 50-day SMA is above both the 150-day and 200-day SMAs, and the 150-day SMA is above the 200-day SMA. This positive order of shorter-term averages above longer-term ones confirms speeding momentum, a main part of the template.
- Nearness to Highs: At $14.81, CODA is trading within 25% of its 52-week high of $14.86. Minervini stresses that real market leaders reach new highs; buying strength near highs, not weakness near lows, is a base of the thinking.
- Large Climb from Lows: The current price is about 157% above its 52-week low of $5.76, well past the template's need of being at least 30% above the low. This shows a strong recovery and set uptrend.
- Better Relative Strength: With a ChartMill Relative Strength (CRS) score of 95.06, CODA is doing better than 95% of all stocks in the market. High relative strength is an important filter in the Minervini plan, as it finds sector and market leaders that often lead rallies.
Basic Momentum: The High Growth Checks
While the Trend Template makes sure a stock is technically healthy, Minervini's full plan requires firm basic foundations to support the price momentum. The "High Growth Momentum" filter looks at recent financial results, and CODA shows several positive signals of speeding up.
- Firm Revenue Growth: The company has reported notable year-over-year revenue growth, with the latest quarter jumping 43.8%. This comes after firm growth in earlier quarters (29.0% and 31.8%), pointing to a continued speeding up in top-line expansion, a main force for growth investors.
- Earnings Strength and Surprises: CODA has a record of positively surprising analysts, having beaten EPS estimates in each of the past four quarters by an average of almost 94%. While recent quarterly EPS growth has been uneven, the trailing twelve-month (TTM) EPS is at $0.36, showing profitability. The ability to regularly beat expectations often works as a trigger for more institutional interest.
- Firm Cash Flow Creation: The company's free cash flow per share (TTM) of $0.53 has increased by over 223% in the past year. Growing cash flow is a key sign of business health and supplies the means for future growth projects without heavy need for outside funding.
- Good Profitability: The company keeps solid profit margins, with the last reported quarter at 14.1%. While margins have varied, the business model shows an ability to turn sales into earnings, which is key for lasting growth.
Technical Report Summary and Current Position
ChartMill's own technical report gives CODA a top-level Technical Rating of 10 out of 10, showing outstanding health across short and long-term trends. The report states the stock is doing better than most of the market and its industry group, and is trading near new 52-week highs. Both the short-term and long-term trends are scored as positive.
However, the report also gives an important note for timing. It gives a lower Setup Rating of 3, showing that while the stock's trend is very good, its recent price movement has been unstable, climbing from about $9.86 to $14.86 in a month. This fast rise means the stock may be stretched in the short term and does not now show a standard, lower-risk pause or "Volatility Contraction Pattern" (VCP) entry point that Minervini supports. The study suggests it may be wise to wait for a time of pause or a move back toward support levels (found near $10.91-$10.95 and $10.03) before thinking about a new entry. A full look at the technical picture, including support areas and detailed study, is in the ChartMill Technical Report for CODA.
Closing
CODA Octopus Group shows a strong picture for investors following a growth momentum plan. It successfully meets the strict technical filters of the Minervini Trend Template, confirming it is in a strong, set uptrend with better relative strength. Basically, it shows signals of speeding up with firm revenue growth, firm cash flow creation, and a record of earnings surprises.
The main point for investors is the difference between a good stock and a good position. CODA now is an example of the first. Its technical and growth facts make it a stock worth putting on a watchlist. The next move for a careful momentum investor would be to watch for a more formed entry position, such as a VCP or a move back to a key moving average, that fits with the risk control ideas central to the Minervini method.
Want to find more stocks that meet this mix of high growth and firm trends? You can use the same filter method with the High Growth Momentum + Trend Template filter on ChartMill.
Disclaimer: This article is for information and learning only. It is not advice to buy or sell any security. The study is based on given data and filter methods described. All investing has risk, including the chance of losing the original amount. You should do your own study and think about talking with a qualified financial advisor before making any investment choices.