
In the search for stocks with high potential, many investors use detailed technical study alongside a screen for fundamental growth. One well-known method is the strategy made popular by Mark Minervini, which focuses on stocks in strong uptrends, as set out by his Trend Template. This method is frequently combined with a look for companies showing solid underlying growth momentum. The aim is to locate securities where a healthy price trend is backed by improving business fundamentals, possibly creating conditions for major price gains. A recent screen using these two filters has identified Compass Minerals International (NYSE:CMP) as a candidate for more detailed study.
Technical Fit with the Minervini Trend Template
The Minervini Trend Template offers a structured checklist to confirm a stock is in a clear, long-term uptrend. For a stock such as CMP, passing these checks is the first step it must clear. According to the data given, Compass Minerals seems to meet the main technical needs:
- Price Above Key Moving Averages: The present price is above the rising 50-day, 150-day, and 200-day simple moving averages (SMAs). This position points to continued buying interest across several time periods.
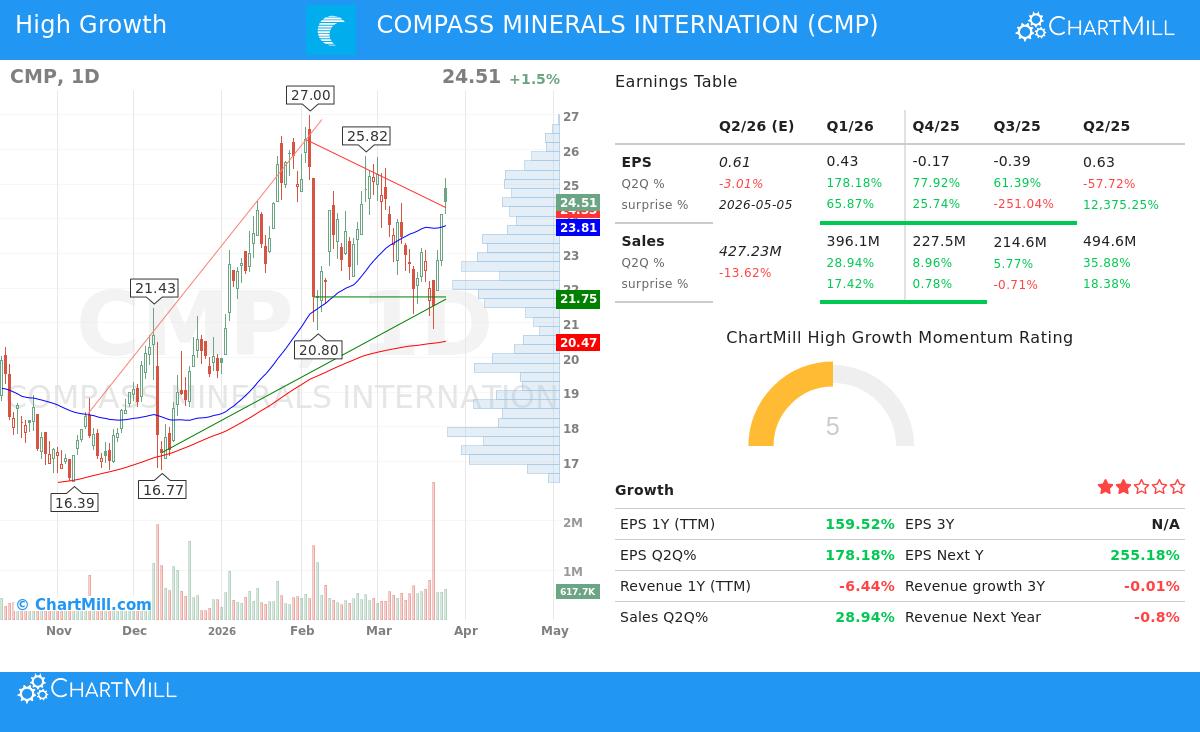
- Moving Average Order: The 50-day SMA ($23.81) is above both the 150-day ($20.49) and 200-day ($20.47) SMAs, and the 150-day SMA is also above the 200-day. This ordered, rising pattern is a typical sign of a solid Stage 2 advance.
- Nearness to Highs: The stock is changing hands within 10% of its 52-week high of $27.00, meeting the template's rule to concentrate on strength over low price. It is also more than 185% above its 52-week low, showing a strong recovery trend.
- Strong Relative Performance: With a ChartMill Relative Strength (CRS) score of 96.24, CMP is doing better than most of the market. Minervini notes that real market leaders usually show high relative strength, often above 70, as it points to institutional interest and sector leadership.
This technical view indicates CMP is not just recovering but is in an organized uptrend, a required beginning for the strategy. The recent pause near highs, mentioned in the technical report, might be forming a base for its next possible move.
Fundamental Growth Momentum
While the Trend Template deals with the "when," the "why" frequently comes from the fundamentals. The related screen also demanded a minimum High Growth Momentum (HGM) rating, which looks for quickening earnings and sales trends. CMP's recent financial numbers show several strong growth signs that fit this idea.
- Earnings Speed Increase: The latest quarterly EPS grew by 178% compared to the year before. This comes after a previous quarter growth of 78%. While earlier quarters varied, this sharp positive change is exactly the kind of earnings event Minervini's SEPA (Specific Entry Point Analysis) method looks for.
- Solid Estimate Surpasses: The company has exceeded EPS estimates in three of the last four quarters, with an average beat above 3,000%. Such large outperformance versus expectations often works as a strong catalyst, gaining the notice of institutional investors and leading to price changes.
- Getting Better Profitability: After a time of difficulty, the profit margin in the last reported quarter grew to 4.7%. A recovery in margins can be an early sign of better operational efficiency and pricing ability, helping lasting earnings growth.
- Healthy Cash Flow Creation: Free cash flow per share has jumped over 171% in the past year, reaching $2.25. Good and increasing cash flow gives a company the ability to invest, reduce debt, or give money to shareholders, supporting the soundness of the business.
It is key to see that not every fundamental measure is positive. Revenue growth on a trailing twelve-month basis is still negative, and analyst estimates for the next year have been lowered. This highlights the choosy nature of the screen, it has found a company showing notable momentum in profitability and earnings beats against a more difficult top-line situation, a detail that needs thoughtful review.
Technical Condition and Setup Summary
ChartMill's own technical report gives a combined view of CMP's chart condition. The stock gets a good Technical Rating of 7 out of 10, showing its solid long-term positive trend and better performance compared to the market and its Metals & Mining industry group. The report states the stock is trading in the higher part of its yearly range, with recently higher volume supporting the price move, a positive signal.
However, the report gives a lower Setup Rating of 3. This means that while the trend is good, the stock may not be in a perfect low-risk entry pattern right now. The study suggests price action has been "a little bit too volatile to find a nice entry and exit point" and that waiting for a pause could be wise. Important support levels are seen around $24.33 and more strongly between $21.50 and $21.75, with nearby resistance near $25.57.
For a full look at the support, resistance, and factor study, you can see the complete ChartMill Technical Report for CMP.
Conclusion
Compass Minerals International offers an interesting example of a stock that clears both a strict technical trend filter and a momentum-based growth screen. Its chart shows the features of a Minervini-style Stage 2 uptrend, marked by rising moving averages and leader-level relative strength. Fundamentally, the company is showing strong quarterly earnings momentum and major positive earnings surprises, main forces that can support continued investor attention.
The pairing indicates that CMP's price strength may be supported by a better profit story. For investors using a growth-and-trend approach, this fits the idea of investing in companies where getting better fundamentals meet a technically confirmed price rise. As usual, the present technical evaluation suggests care for a clearer entry setup, noting that discipline in entry points is as important as stock selection.
Interested in locating other stocks that match this mix of solid trends and growth momentum? You can examine the screening settings more via this High Growth Momentum + Trend Template screen on ChartMill.
Disclaimer: This article is for informational and educational purposes only. It does not constitute financial advice, a recommendation, or an endorsement to buy or sell any security. The analysis is based on provided data and screens, and investors should conduct their own due diligence and consult with a qualified financial advisor before making any investment decisions. Past performance is not indicative of future results.