
Our stock screener has flagged COMCAST CORP-CLASS A (NASDAQ:CMCSA) as a potential breakout candidate. This occurs when the stock shows signs of consolidation after a notable upward trend. While we can't predict the actual breakout, it's worth monitoring NASDAQ:CMCSA for potential movement.
What is the technical picture of NASDAQ:CMCSA telling us.
Every day, ChartMill assigns a Technical Rating to each stock, providing a score ranging from 0 to 10. This rating is determined by evaluating various technical indicators and properties.
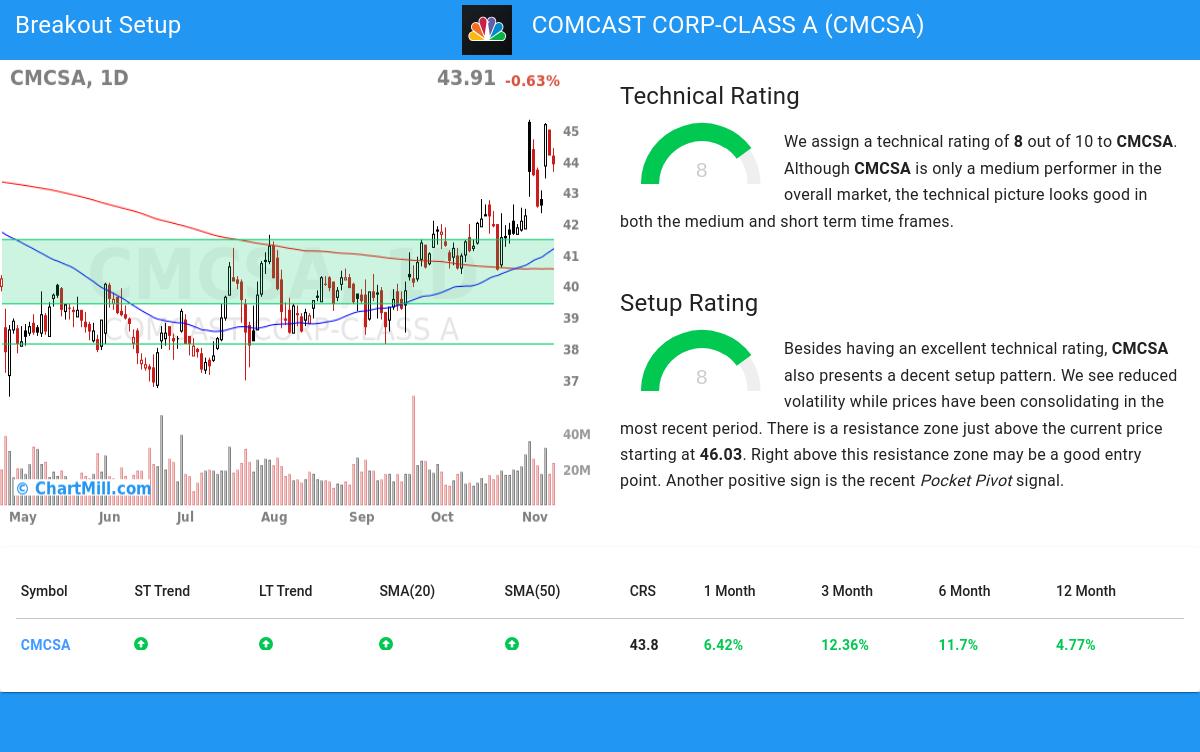
Overall CMCSA gets a technical rating of 8 out of 10. Although CMCSA is only a medium performer in the overall market, the technical picture looks good in both the medium and short term time frames.
- Both the short term and long term trends are positive. This is a very positive sign.
- CMCSA is currently trading in the upper part of its 52 week range. The S&P500 Index however is currently trading near a new high, so CMCSA is lagging the market slightly.
- In the last month CMCSA has a been trading in the 40.46 - 45.31 range, which is quite wide. It is currently trading near the high of this range.
- When compared to the yearly performance of all other stocks, CMCSA outperforms 43% of them, which is more or less in line with the market.
- CMCSA is part of the Media industry. There are 92 other stocks in this industry, CMCSA did better than 53% of them.
For an up to date full technical analysis you can check the technical report of CMCSA
Looking at the Setup
Next to the Technical Rating, the Setup Rating of a stock determines to which extend the stock is consolidating. This score also ranges from 0 to 10 and is updated daily. The setup score evaluates various short term technical indicators. For NASDAQ:CMCSA this score is currently 8:
Besides having an excellent technical rating, CMCSA also presents a decent setup pattern. Prices have been consolidating lately and the volatility has been reduced. There is a resistance zone just above the current price starting at 46.03. Right above this resistance zone may be a good entry point. Another positive sign is the recent Pocket Pivot signal.
How to trade NASDAQ:CMCSA?
A breakout could materialize when the stock breaks out to new highs above the current consolidation zone. One could wait for this to happen and buy when this happens. A stop loss could be placed below the consolidation zone.
Please note that this article should not be construed as trading advice. The information provided is solely based on automated technical analysis and serves to highlight technical observations. It is important to conduct your own analysis and make trading decisions based on your own judgment and responsibility.
Our Breakout screener lists more breakout setups and is updated daily.
Disclaimer
This is not investing advice! The article highlights some of the observations at the time of writing, but you should always make your own analysis and invest based on your own insights.