
For technical investors, finding stocks that are in a solid uptrend and may be ready for their next rise is a central strategy. One methodical path involves looking for stocks that join sound technical condition with a good consolidation pattern, hinting at a possible breakout. This technique centers on two specific metrics: the ChartMill Technical Rating, which judges the general condition and direction of a stock, and the ChartMill Setup Quality Rating, which judges the condition of its present price consolidation. A stock with high marks in both areas presents an interesting chance, it is a solid performer pausing before possibly continuing its climb.
Bunge Global SA (NYSE:BG), a global agribusiness and food company, is now a clear example of this pattern. The stock's technical condition and recent price movement match the needs of this breakout method.
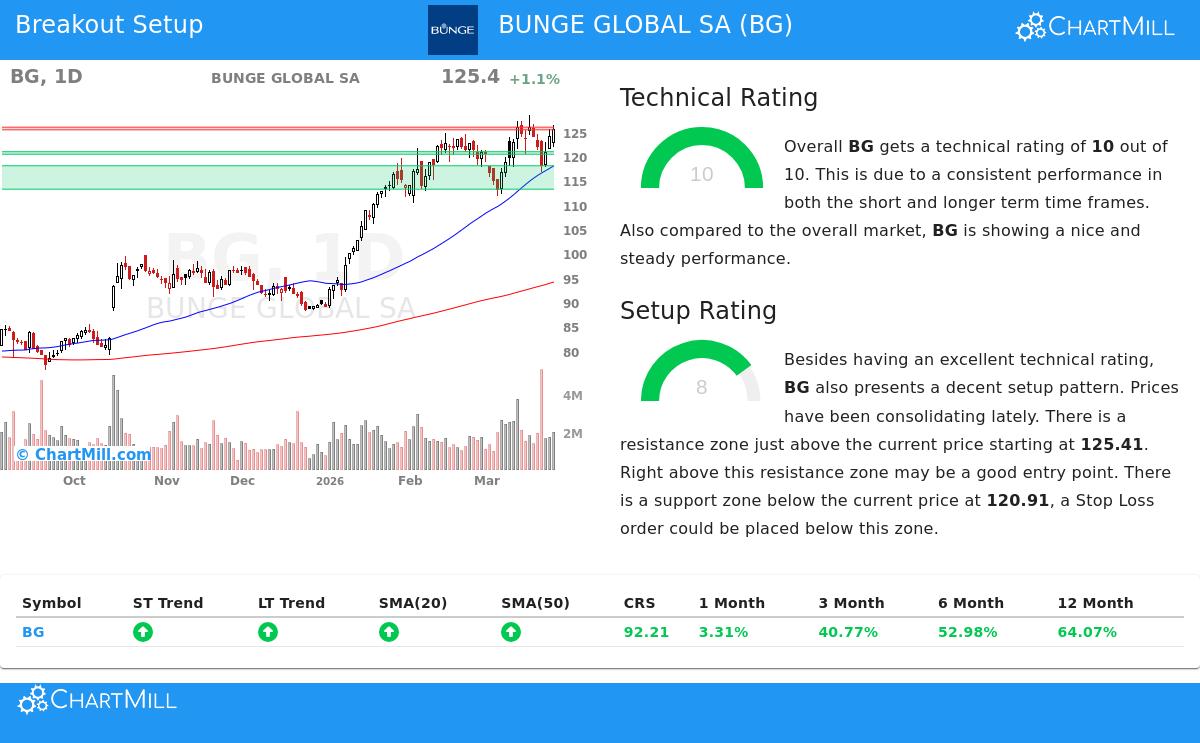
Technical Condition: A Base of Strength
The base of any breakout candidate is a shown strong existing trend. Bunge Global’s technical rating of a full 10 out of 10 first shows very good condition. A look into the full technical report shows the parts of this condition:
- Trend Direction: Both the short and long-term trends for BG are clearly positive. This agreement across periods is a solid positive sign, pointing to continued buying interest.
- Market and Group Comparison:
- The stock’s yearly result puts it ahead of 92% of all stocks in the market.
- Inside the Food Products group, it does better than 93% of its 87 peers, showing clear relative condition.
- Price Level: BG is trading close to its 52-week high, showing it can keep its pace. Importantly, while the wider S&P 500 is not close to new highs, BG is ahead of the market, a sign of separate condition often seen in group leaders.
- Moving Average Condition: The stock price is above all main simple moving averages (20, 50, 100, and 200-day), and each average is rising. This makes a layered base under the price.
This full technical rating answers the "which stock" question for investors. It confirms BG is not a short-term rise but a stock in a confirmed, solid uptrend, making it a fit candidate for more review.
Setup Condition: The Pause Before the Change
A solid trend alone is not a signal to buy; entering a stretched stock can lead to quick declines. This is where the Setup Quality rating of 8 becomes key. It shows BG is in a time of consolidation, giving a possible entry point with clear risk.
The review shows BG has been trading between about $111.72 and $128.46 over the last month. While broad, the stock is now testing the top edge of this area. More importantly, the setup finds clear, close support and resistance levels that help outline a possible trade:
- Resistance Area: A set resistance area exists between $125.41 and $125.96, made by several trendlines. A clear move above this area could signal the start of the next positive phase.
- Support Area: A solid support area sits between $120.39 and $120.91, supported by trendlines and moving averages. This gives a logical area to place a protective stop-loss order, limiting loss if the breakout does not happen.
This consolidation, after a large upward move, lets the stock ease overbought conditions and gather energy for its next climb. The high setup rating confirms that the present price pattern gives a measurable risk/reward situation, answering the "when to buy" question by marking a specific breakout level and a close stop-loss level.
Summary and Possible Trade Plan
Bunge Global SA shows a standard case for technical breakout investors. Its full Technical Rating of 10 confirms it is a group leader in a solid uptrend, while its Setup Rating of 8 shows it is absorbing gains in an organized consolidation near new highs. The meeting of these two high scores suggests the stock may be getting ready to continue its upward path.
For investors using this method, the automatic review suggests a possible setup with an entry point just above the resistance area at $125.97 and a first stop-loss just below the support area at $120.38. As usual, this computer-made example should be the beginning point for one's own review, thinking about personal risk limits and confirming no opposing basic news like coming earnings.
Interested in finding more stocks that match this high-likelihood breakout pattern? You can use the same screen used to find BG and get new results each day by going to the Technical Breakout Setups page.
Disclaimer: This article is for information and learning only and is not investment advice, a suggestion, or an offer or request to buy or sell any securities. The review given is based on technical measures and should not be the only base for any investment choice. All trading and investment actions involve large risk, and you should do your own study and talk with a qualified financial advisor before making any financial choices. Past results are not a guide for future results.