
The strategy of Peter Lynch, the legendary manager of Fidelity’s Magellan Fund, is often described as a "GARP" (Growth at a Reasonable Price) approach. As detailed on Chartmill, Lynch advocated for buying companies with sustainable earnings growth that are available at a discount relative to their growth rate. Rather than chasing the fastest-growing firms or the cheapest value traps, his method focuses on the sweet spot: businesses with a 5-year historical EPS growth rate between 15% and 30%, a PEG ratio (P/E divided by growth) at or below 1.0, a Debt-to-Equity ratio under 0.6, a Current Ratio above 1.0, and a Return on Equity (ROE) exceeding 15%. These criteria ensure that the company is not only growing, but doing so profitably, with a healthy balance sheet, and at a fair price—all essential characteristics for long-term, buy-and-hold investors.
Acuity Inc (NYSE:AYI) appears to be a textbook candidate for this GARP strategy. The company, which provides lighting and building management solutions across North America, Europe, and Asia, fits Lynch’s preference for understandable, industrial businesses that solve practical problems. Its recent performance metrics align closely with the specific filters of the Peter Lynch screen.
Fundamental Metrics and Lynch Criteria
When we dig into the numbers provided by the screening results, it becomes clear why Acuity stands out.
-
Earnings Per Share (EPS) Growth: The company shows a 5-year historical EPS growth rate of 16.88%. This places it squarely in the “sustainable” range (15% to 30%) that Lynch identified. It shows the company is growing at a healthy clip, but not at a speculative, unsustainable pace. For a long-term holder, this kind of steady expansion is far more valuable than a short burst of 40% growth that cannot be maintained.
-
Valuation (PEG Ratio): The PEG ratio is a core metric of the Lynch strategy. Acuity’s PEG ratio (based on past 5-year growth) stands at 0.88. A PEG ratio below 1.0 suggests that the market is not fully pricing in the company’s growth potential. In other words, you are getting the growth at a discount. This is precisely the kind of “reasonable price” that GARP investors seek.
-
Financial Health: Lynch was famously cautious about debt and liquidity. Acuity’s Debt-to-Equity ratio is a conservative 0.25, well below the required threshold of 0.6. This low leverage indicates that the company funds its operations primarily through equity, reducing financial risk. Furthermore, its Current Ratio of 2.07 easily surpasses the 1.0 minimum, ensuring that short-term obligations are covered with healthy current assets.
-
Profitability (Return on Equity): The Return on Equity (ROE) of 15.13% exceeds the 15% threshold set by the strategy. This confirms that the company is not just growing for the sake of growth, but is generating real profits on shareholder capital. The ROE is a direct indicator of management’s effectiveness in deploying capital, a quality Lynch highly valued.
Fundamental Report Summary
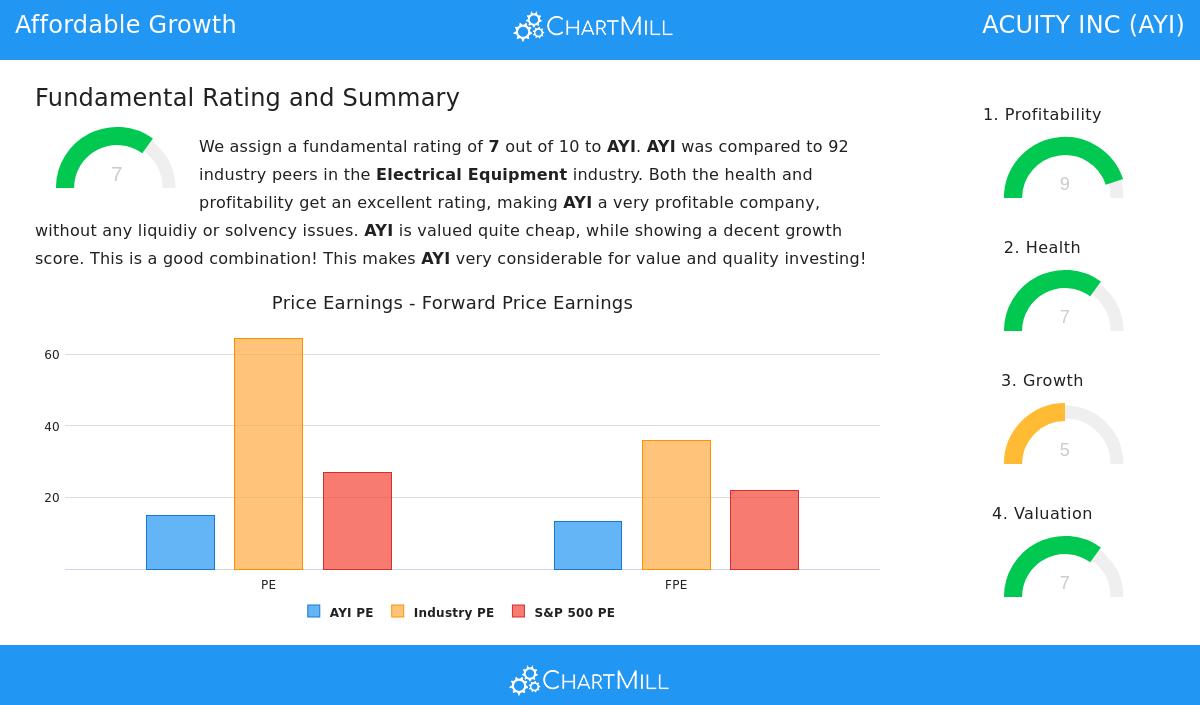
Looking at the broader picture beyond the screening criteria, the fundamental report reinforces the positive view. Overall, Acuity receives a strong rating of 7 out of 10, supported by excellent profitability and healthy financial stability.
- Profitability Score (9/10): The company shows strong profit margins (9.37% net margin, 14.27% operating margin, and 48.73% gross margin) that are among the best in the Electrical Equipment industry. It also has a solid track record of consistent profitability over the past five years.
- Health Score (7/10): The balance sheet is solid, with an Altman-Z score of 6.08 (indicating no bankruptcy risk), a low Debt-to-FCF ratio of 1.25, and a manageable debt level.
- Valuation Score (7/10): Acuity is trading at a P/E ratio of 14.89 and a Forward P/E of 13.24, making it significantly cheaper than the industry average and the S&P 500. Other metrics like Enterprise Value to EBITDA also confirm a cheap valuation relative to peers.
- Growth Score (5/10): While the past growth is strong, the report notes that future EPS growth is expected to slow to about 8.45% annually. This is still positive, but a deceleration worth monitoring. However, the current low PEG ratio provides a margin of safety against this slowdown.
You can view the full fundamental breakdown on Chartmill by following this link: Acuity Inc Fundamental Analysis Report.
Analyst Views and Market Context
From a macro perspective, the current climate supports quality stocks. The S&P 500 shows a positive long-term and short-term trend, which can provide a tailwind for well-managed companies like Acuity. While the stock is not a pure high-growth play, its combination of reasonable valuation, strong margins, and low debt makes it a resilient candidate for a buy-and-hold portfolio. Lynch would likely approve of its steady growth profile—solid, not spectacular, and backed by real business fundamentals.
For investors looking for more opportunities that fit this value-driven growth approach, you can run the complete Peter Lynch screen yourself to find additional promising candidates. Click here to view the full Peter Lynch screen results and find more GARP opportunities.
Disclaimer: This article is for informational and educational purposes only and does not constitute investment advice. Past performance and screening metrics are not a guarantee of future results. You should conduct your own research and consult with a qualified financial advisor before making any investment decisions.