
Investors looking to find market leaders with high growth potential frequently use systematic strategies that mix strict technical and fundamental analysis. One method is supported by well-known trader Mark Minervini, whose Specific Entry Point Analysis (SEPA) system works to find stocks ready for large moves. The foundation of this method is the Trend Template, a technical checklist confirming a stock is in a strong, confirmed uptrend. To add to this, the strategy requires good underlying business momentum, concentrating on speeding up earnings, sales growth, and better profit margins. By selecting for stocks that meet both the technical template and high-growth fundamental standards, investors try to locate likely candidates in the beginning parts of a major rise.
ANGLOGOLD ASHANTI PLC (NYSE:AU) offers a strong example for this mixed method. The global gold mining company, with a varied set of operations in four continents, is now showing the exact technical and fundamental traits that Minervini's strategy aims to find.
Matching the Minervini Trend Template
The first test for any possible candidate is meeting the technical requirements of the Trend Template. This group of rules works to remove weak or correcting stocks, making sure focus stays on those with clear, institution-supported momentum. A look at AngloGold Ashanti's chart shows a firm match with these points:
- Price Above Key Moving Averages: The stock's present price trades steadily above its rising 50-day, 150-day, and 200-day simple moving averages (SMAs). This ordered position shows continued buying pressure across short, medium, and long-term periods.
- Positive Moving Average Trends: Importantly, the 150-day and 200-day SMAs are both in confirmed uptrends, indicating a sound long-term bull phase. Also, the 50-day SMA is positioned above both the 150-day and 200-day SMAs, a standard arrangement for gaining momentum.
- Nearness to Highs: The stock is trading well above 30% of its 52-week low and stays close to its yearly high. This meets Minervini's choice for stocks showing strength and leadership, not those trying to come back from large drops.
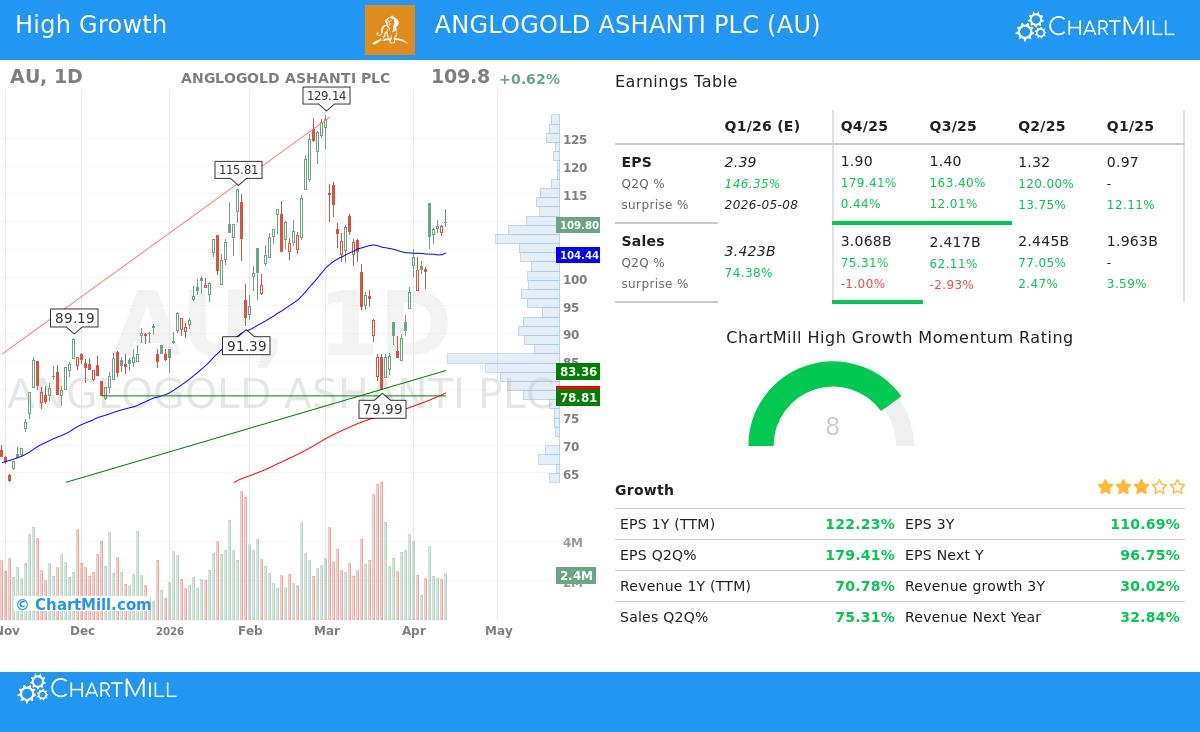
- Better Relative Strength: With a ChartMill Relative Strength (CRS) ranking of 94.16, AU does better than 94% of all stocks in the market over the last year. High relative strength is a key part of the strategy, as it finds sector leaders that often draw continued institutional investment.
This technical view shows why the Trend Template is so important: it clearly finds stocks already in a strong Stage 2 rise, avoiding the problems of trying to buy a declining stock or invest in poor performers.
Showing High-Growth Momentum
While a strong chart is necessary, Minervini states that the largest winners are nearly always backed by outstanding fundamental performance. The "High Growth Momentum" part of the screen looks for proof of speeding business growth, which AngloGold Ashanti has supplied clearly.
- Large Earnings Growth: The company's earnings per share (EPS) growth is very large. Year-over-year EPS growth is over 122%, and the newest quarter saw a 179% rise compared to the same time last year. This kind of speed gain is a main driver that draws market notice.
- Strong Revenue Growth: Top-line growth is also notable, with trailing twelve-month revenue up about 71%. The latest quarterly sales grew over 75% year-over-year, showing good operational performance and possibly helpful gold market conditions.
- Gaining Profitability: Beyond pure growth, the quality of earnings is getting better. The company's profit margin has grown noticeably, reaching almost 28% in the last reported quarter, up from levels near 17% in the previous fiscal year. Better margins suggest pricing control and operational efficiency, signs of a high-quality business.
- Positive Analyst Changes: Forward-looking estimates are being moved upward, with the average EPS estimate for the next year raised by over 32% in the last three months. Such changes often come before more price gains as the market adds improved future expectations into the present stock price.
These fundamental measures are important because, as Minervini says, "big earnings attract big attention." They supply the fundamental driver that, when joined with a good technical setup, can support a continued price rise.
Technical Condition and Present Position
According to ChartMill's own analysis, ANGLOGOLD ASHANTI PLC receives a complete technical rating of 10 out of 10, showing very good condition across all checked timeframes. The long-term and short-term trends are both rated as positive, and the stock is a clear leader in the Metals & Mining industry. However, the analysis also notes a present setup rating of 3. This shows that while the stock's technical base is very good, its recent price action has been unstable, making the finding of a low-risk, exact entry point difficult now. The report proposes waiting for a time of sideways movement to form, which would give a clearer support level for planned entry and a closer stop-loss point.
For a full look at the support and resistance levels, volume trends, and other technical details, readers can see the complete ChartMill Technical Analysis Report for AU.
Locating Like Possibilities
ANGLOGOLD ASHANTI PLC shows the kind of candidate that comes from a strict search for high-growth momentum inside a strong technical trend. For investors wanting to use this method to find other possible chances, the preset screen that found AU can be a helpful beginning point. You can view the present results and change the settings to your own standards via this High Growth Momentum + Trend Template screen.
Disclaimer: This article is for informational and educational purposes only. It is not a recommendation to buy or sell any security. The analysis is based on current data and a specific investment methodology, but past performance is not indicative of future results. Always conduct your own due diligence and consider consulting with a qualified financial advisor before making any investment decisions. Please read our full disclaimer here.