
For technical investors looking to find stocks ready for their next rise, a common method uses two main ideas: trend strength and entry timing. This method looks for securities that are in clear, good uptrends and are also trading in a narrow range, preparing for a possible breakout. By selecting stocks with a high technical rating (showing a solid trend) and a high setup quality rating (showing a consolidation period), traders try to join a trend's continuation from a good entry point, with clear risk limits. This process helps answer the important questions of which stock to look at and when to look at it.
A recent scan using this method has identified Archrock Inc. (NYSE:AROC), a top provider of natural gas compression services in the United States. The company's stock shows an interesting example, getting high scores in both trend health and setup quality, indicating it could be forming a technical breakout pattern.
Technical Strength: The Basis of the Trend
The main filter in a breakout scan is a stock's basic technical health. A high technical rating means a solid and steady uptrend across different time periods, which is important because it makes it more likely a breakout will continue the existing trend instead of being a false signal.
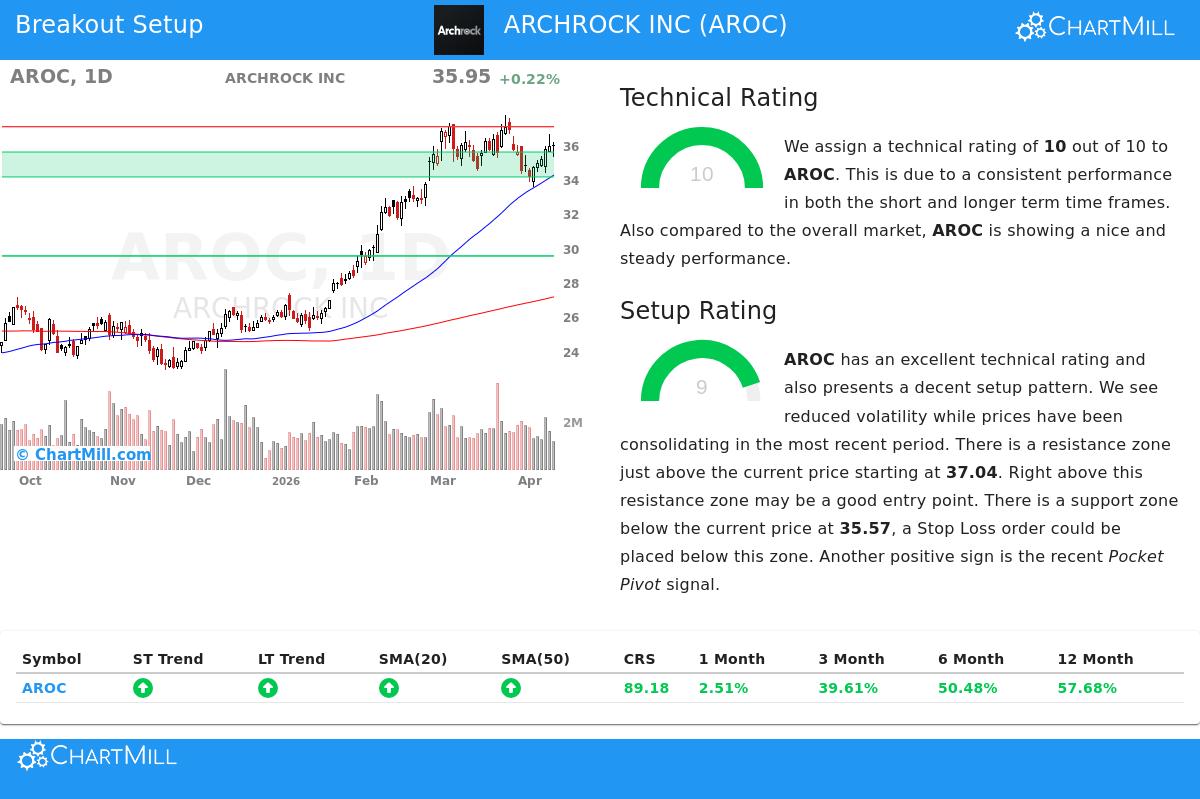
Archrock's technical picture is very solid, receiving a top rating of 10 out of 10. A look at the detailed technical report shows the reasons for this strength:
- Trend Alignment: Both the long-term and short-term trends for AROC are rated as positive. This agreement across time periods shows steady buying pressure and no major conflict in the price movement.
- Moving Average Support: The stock is priced above all its main simple moving averages (SMAs, 20, 50, 100, and 200-day), and each average is also rising. This stacked, positive arrangement of support levels is a typical sign of a solid uptrend.
- Market-Relative Performance: Compared to the wider group of stocks, AROC is doing better than 89% of them over the last year. This better relative performance shows the stock is a leader, not just going up with a positive market.
This mix of factors gives a firm technical base. For a breakout method, entering a stock with this degree of trend soundness is better, as the momentum is already in place and positive.
Setup Quality: Finding the Consolidation
While a solid trend is needed, it is not enough for a good breakout setup. A stock that has climbed sharply may be stretched and likely to fall back. The second important filter is the setup quality rating, which finds times of consolidation or tight trading ranges. A high score here suggests the stock is "coiling" or gathering energy, giving a clear area of support and a reasonable level for a possible breakout.
Archrock gets a 9 out of 10 on the Setup Quality rating, meaning a very good consolidation pattern. The technical report explains why:
- Lower Volatility and Set Range: The stock has been trading inside a set range over the last month ($33.55 - $37.73). Lately, price movement has stabilized near the middle of this range, with volatility decreasing—a common behavior before a breakout.
- Clear Support and Resistance Areas: The analysis finds a key support area between $34.12 and $35.57, made by a combination of moving averages and trendlines. On the other hand, a set resistance area is just above the current price, around $37.04 to $37.05.
- Recent Accumulation Signal: A "Pocket Pivot" signal was seen very recently. This is a volume-based sign that suggests accumulation by bigger participants during the consolidation phase, adding confirmation to the setup.
This high-grade consolidation is what makes AROC a possibility for a breakout trade. The narrow range gives a clear level to watch for an upward move past resistance and a close level to control risk at support.
The Possible Breakout Setup
Combining the very good technical strength with the high-grade consolidation, the analysis points to a specific possible setup. The nearby resistance area starts at $37.04. A clear move above this level, especially with higher-than-normal volume, could mark the beginning of the next positive phase, giving a possible entry point.
The solid support area below, focused around $35.57, gives a logical place to set a protective stop-loss order. This creates a clear and measurable risk situation, which is a key part of careful technical trading. The space between this possible entry and stop-loss levels leads to a risk of about 8% on the trade, allowing for exact position sizing.
Conclusion
Archrock Inc. shows a classic example of the kind of opportunity technical breakout screens are made to find. The stock has the two features technical investors often want: a strong, confirmed uptrend shown by a top technical rating, and a calm, high-grade consolidation period near highs, as seen in its near-top setup score. This mix indicates AROC could be getting ready for its next important upward move.
Find new possible breakout setups each day. The process used to find Archrock can be used regularly on the market. For investors wanting to see the present list of stocks fitting similar high technical and setup conditions, you can check the live results using the Technical Breakout Setups screen.
Disclaimer: This article is for information only and is not investment advice, a suggestion, or an offer or solicitation to buy or sell any securities. The analysis uses technical data and automated scoring models. All investing and trading has risk, including the possible loss of principal. Past results do not guarantee future outcomes. Always do your own research and think about your financial position and risk tolerance before making any investment decisions.