
Investors looking to find stocks with strong growth potential frequently use organized methods that join strict technical and fundamental study. One well-known tactic is the system created by noted trader Mark Minervini. His technique, built on the Specific Entry Point Analysis (SEPA) system, aims to locate stocks that are in strong upward trends, supported by improving fundamental growth, and are set for a notable price change. The tactic uses a fixed list called the Trend Template to sort for stocks with better technical qualities, while also requiring good sales and earnings speed to confirm the company's business path matches the price movement. This pairing tries to find leading stocks early in their large gains while carefully controlling risk.
APYX MEDICAL CORP (NASDAQ:APYX), a medical technology company based in Clearwater, Florida, recently appeared from a stock scan made to find securities that match both the Minervini Trend Template and criteria for high-growth speed. This two-step filter looks for companies that are not only in a technically sound upward trend but also show the fundamental improvement that often supports continued price gains.
Technical Match with the Minervini Trend Template
The center of Minervini's stock picking process starts with the Trend Template, a group of fixed technical requirements that verify a stock is in a solid, confirmed upward trend (Stage 2). APYX seems to meet these important measures, which are made to remove weak or correcting stocks and concentrate only on those with clear strength.
- Price Above Key Moving Averages: The stock's present price trades above its rising 50-day, 150-day, and 200-day simple moving averages (SMAs). This order shows continued buying pressure across short, medium, and long-term periods.
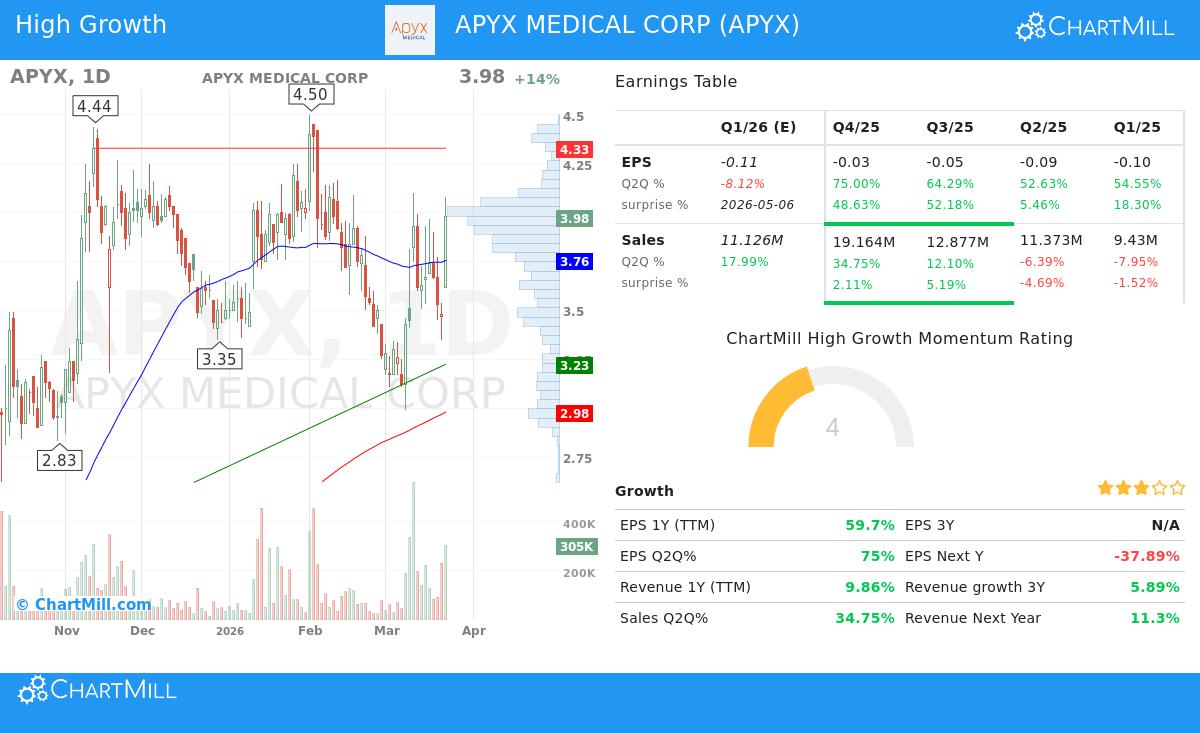
- Moving Average Order: The 50-day SMA ($3.76) is above both the 150-day SMA ($3.28) and the 200-day SMA ($2.98), while the 150-day SMA is also above the 200-day SMA. This positive sequence of averages is a sign of a good upward trend, showing that shorter-term speed is guiding longer-term direction.
- Nearness to Highs: A main idea of the Minervini view is to concentrate on strength, not weakness. APYX's present price is about 427% above its 52-week low of $0.76 and within 12% of its 52-week high of $4.50. This shows strong recovery speed and places the stock as a possible leader, not a follower.
- Better Relative Strength: Maybe most significant is the stock's ChartMill Relative Strength (CRS) score of 97.53. This means APYX has done better than about 98% of all stocks in the market over the past year. Minervini states that real market leaders regularly do better than the wider market, and a high RS score is an important filter for finding them.
These technical conditions together indicate APYX is in a confirmed Stage 2 rise, meeting the strict first screen that Minervini supports before any fundamental study starts.
Fundamental Reasons for High Growth Speed
While the Trend Template finds the "how," the "why" behind a stock's move is found in its fundamental results. The High Growth Momentum (HGM) score looks for companies showing improving business trends, which Minervini notes as a common feature in top-performing stocks. APYX shows several encouraging signs of fundamental improvement.
- Earnings Growth Improvement: The company has shown notable gain in its bottom line. Year-over-year EPS growth has improved greatly, from -52.3% three years ago to a solid +59.7% in the most recent trailing twelve-month period. Even more notable is the recent quarterly speed, with the last four quarters showing sequential year-over-year EPS growth of 54.5%, 52.6%, 64.3%, and 75.0%. This sequence of improving earnings growth is a strong force that draws institutional interest.
- Regular Earnings Surprises: APYX has exceeded analyst EPS estimates in all of the last four quarters, with an average surprise of over 31%. Positive earnings surprises often lead to higher changes in future estimates and greater investor trust, supporting further price speed.
- Gaining Revenue Path: After a time of decrease, revenue growth has become positive. The most recent quarter saw sales grow by nearly 35% year-over-year, a sharp gain from the previous quarters. Analyst view for future sales has also improved, with next-year revenue estimates changed upward by 5.7% over the last three months.
- Good Cash Flow Gain: Supporting the earnings story, the company's free cash flow per share has gained by over 51% in the past year. This shows the earnings growth is turning into real cash creation, a positive sign for the business's financial condition and endurance.
Technical Condition and Setup Review
Beyond the basic Trend Template filters, a wider technical study gives setting for the present trading setup. According to ChartMill's automated technical report, APYX receives a high technical score of 9 out of 10, reflecting its very good long-term trend and better performance compared to the market and its healthcare equipment sector group.
The report notes the stock is trading in the higher part of its 52-week range and has seen strong price action lately. However, the present Setup Quality score is a medium 6, suggesting that while the trend is very good, the stock may be stretched in the short term. The study states price action has been "a little bit too volatile to find a nice entry and exit point" at this moment and that waiting for a period of stability or a pullback might be wise. This points out a key part of the Minervini tactic: finding a strong candidate is only the first step; entering at a clear, low-risk turning point is important for controlling risk. You can see the full, detailed technical study for APYX here.
Finding Like Chances
APYX Medical Corp offers an example of a stock that meets strict technical and growth-focused fundamental filters. For investors interested in searching for like chances that match the Minervini approach and show high-growth speed, a preset scan is ready. You can view and run the "High Growth Momentum + Trend Template" scan here to see present market candidates.
Disclaimer: This article is for information and learning only. It is not a suggestion to buy, sell, or keep any security. The study is based on given data and preset scanning methods. All investing and trading includes risk, including the possible loss of principal. Always do your own complete research, think about your personal money situation, and talk with a qualified financial advisor before making any investment choices.