
For investors using charts and price action to inform their choices, a methodical way to find possible trades is important. One technique looks for stocks that show both good basic technical condition and a distinct, usable price formation. This tactic centers on two main proprietary measures: the ChartMill Technical Rating, which measures a stock's general trend condition, and the ChartMill Setup Quality Rating, which evaluates the condition of its present tightening formation. The aim is to locate stocks with good technicals that are tightening, possibly ready for their next notable upward price movement. A recent filter using this technique has identified Air Products & Chemicals Inc (NYSE:APD) as a candidate deserving more examination from a technical viewpoint.
A Base of Technical Condition
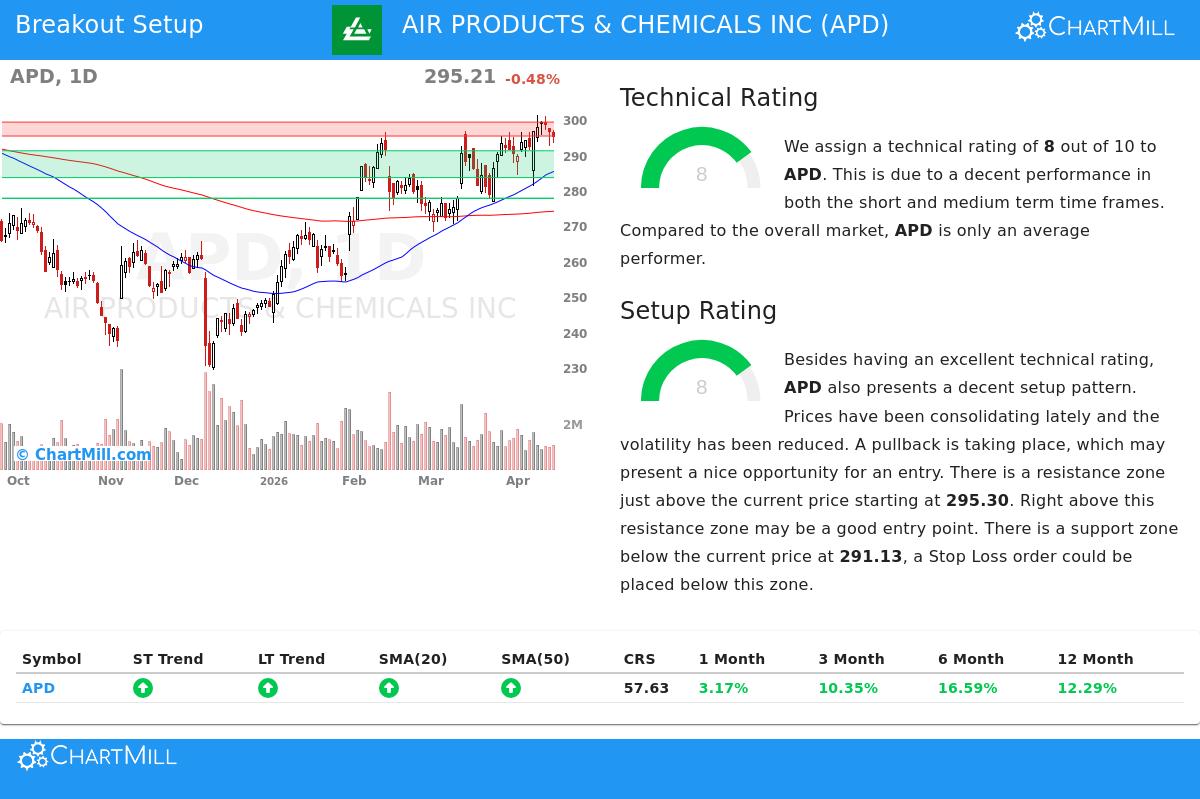
The first part of this breakout tactic is a high Technical Rating, which confirms the stock is in a verified uptrend and not struggling against wider market pressure. Based on the detailed technical report, APD receives a rating of 8 out of 10. This number shows a favorable agreement across various time periods and technical indicators, offering a firm base for any possible trade.
Important elements supporting this good rating are:
- Favorable Trend Agreement: Both the extended and near-term trends for APD are rated as favorable. This agreement is a standard indicator of a sound uptrend, as momentum is steady across different timeframes.
- Good Moving Average Backing: The stock is priced above all its main simple moving averages (20, 50, 100, and 200-day), and each average is itself in a rising pattern. This layered, rising support formation is a positive technical feature.
- Nearness to Highs: APD is presently priced close to its 52-week high of $301.25. While its performance compared to the wider market is moderate, trading near highs in a favorably trending market shows the stock is joining the general upward momentum instead of falling behind.
This mix of elements indicates APD is not in a corrective or resting phase but is in a distinct, confirmed uptrend. For a breakout tactic, this is necessary; it raises the chance that a move above resistance will follow the existing direction of the trend instead of faltering.
A Good Formation Appears
A good trend by itself is not a buy signal. Buying a stock that has already made a big, prolonged move can be hazardous. The second vital measure, the Setup Quality Rating, solves this by finding times of tightening or contracting price movement inside the uptrend. APD scores an 8 here too, showing a good formation is present.
The formation examination indicates a stock that has been gathering energy for a possible next upward phase:
- Lowered Volatility and Tightening: The report mentions "lowered volatility while prices have been tightening in the latest period." This kind of activity, often viewed as a contracting trading range, usually comes before notable directional moves.
- Specific Support and Resistance: The examination finds clear technical levels. A support area is located between $283.54 and $291.13, made by a mix of moving averages and trendlines. Just above, a resistance area exists between $295.30 and $299.24. This creates a specific area where a breakout decision is probable.
- Usable Trade Guidelines: From these levels, the report describes a possible technical formation. An entry might be thought about on a move above the resistance area around $299.25, with a stop-loss order set below the support area near $283.53. This framework gives clear rules for entry and risk control, which are fundamental parts of orderly technical trading.
Summary and Following Actions
The combined presence of a high Technical Rating and a high Setup Quality Rating makes APD a notable chart for technical investors to watch. It shows a situation where a stock with clear trend condition is pausing in a useful way, preparing for a possible resumption of its rise. The specific support and resistance levels give a plan for judging the stock's next move.
It is necessary to recall that a good formation does not assure a winning breakout. Prices may stay in tightening or turn lower. So, any trade from this examination should use careful risk control, including stop-loss orders, and think about wider market states. The S&P 500's present extended favorable trend gives a supporting environment, but its neutral near-term trend indicates careful choice is important.
Find More Possible Breakout Formations This examination of Air Products & Chemicals was produced from a daily filter made to select for stocks showing both technical condition and good formations. New possibilities are found often as market states change. You can see the present list of qualifying stocks by going to the Technical Breakout Setups filter.
Disclaimer: This article is for information only and is not investment guidance, a suggestion, or an offer to buy or sell any security. The examination uses technical measures and past data, which are not promises of future results. Investors should do their own study and work and think about talking with a qualified financial advisor before making any investment choices. Trading securities has risk, including the possible loss of initial funds.