
Investors often look to balance the chance for high gains with a careful method for risk. One way that tries to do this is joining solid fundamental growth traits with positive technical chart formations. The process involves looking for companies showing strong and quickening earnings and sales growth—a sign of traditional growth stocks—while also displaying good financial condition and earnings. This fundamental force is then combined with a technical study that finds stocks moving out of periods of sideways trading or moving above important price ceilings, hinting at a possible starting point matched with a new rising price direction. This meeting of measurable force and good price movement tries to find chances where a company's getting better business basics may be starting to show in its stock price.
ALNYLAM PHARMACEUTICALS INC (NASDAQ:ALNY) shows a situation that fits this investment method. As a biopharmaceutical company centered on RNA interference therapeutics, Alnylam has become a commercial-stage business with an increasing list of approved treatments for rare diseases.
Fundamental Growth Force
The center of the growth investment case for Alnylam depends on its outstanding financial increase, as explained in its fundamental analysis report. The company gets a high Growth Rating of 8 out of 10, pushed by very fast recent results and solid future outlooks.
- Very Fast Past Growth: Over the last year, Alnylam reported a very high 191.24% increase in Earnings Per Share (EPS) with a 65.19% jump in revenue. This shows the company is effectively growing its commercial activities.
- Solid Forward Estimates: Experts predict this speed to keep going, with estimated average yearly EPS growth of almost 65% and revenue growth of 24.6% over the next few years. For a growth investor, this forward path is as important as past results.
- Supporting Earnings: This growth is turning into earnings. The company's Profitability Rating of 6 is backed by margins that score well inside the competitive biotechnology field, including a Gross Margin over 81% and a positive Return on Equity of nearly 40%. This hints the growth is of a high-quality, financially steady kind.
Valuation and Financial Condition Setting
While the growth story is strong, a full view needs looking at valuation and financial soundness. Alnylam's Valuation Rating is a neutral 6. The stock has a high absolute P/E ratio, which is common for fast-growth biotech companies spending much on future research. However, measured against its industry group, the valuation seems more acceptable, and the high estimated growth rate gives some reason for the higher price.
The company's Financial Health Rating is a medium 5. Important notes involve a good Altman-Z score showing low short-term bankruptcy danger and a healthy current ratio indicating enough cash to cover near-term needs. A significant point of attention is the high debt-to-equity ratio, which shows the capital-heavy character of drug creation and sales. This is a point investors watch carefully, though it is partly balanced by the company's good recent cash flow production.
Technical Picture for a Possible Move Higher
The fundamental story of solid growth is given a possible timing setting by the technical view. According to the technical analysis report, Alnylam's stock shows an interesting picture even with a low total technical rating, which is mostly because of a still-negative long-term direction.
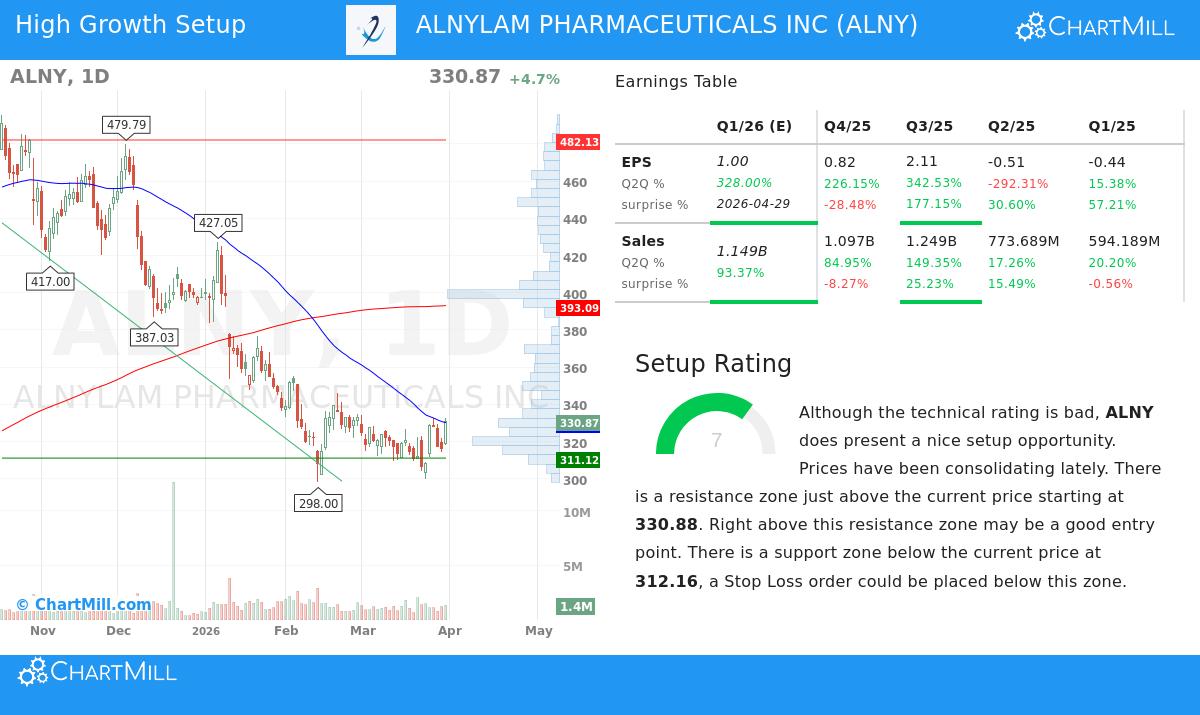
- Sideways Trading Near a Ceiling: The stock has been changing hands in a set area between about $299 and $332 over the last month and is now testing the top edge of this area.
- Important Point to Observe: A clear resistance area sits just above the present price, near $330.88. A continued move above this area on high trading volume could be seen by technical analysts as a sign that buying force is beating selling force, possibly starting a new short-term rising direction.
- Clear Risk Limits: The technical picture finds a support area below near $312. This gives a possible guide for handling risk, as a move below this support could cancel the positive picture.
This formation of sideways trading after a past drop, followed by a test of an important resistance point, is exactly the sort of "technical breakout formation" the screening process looks for. It hints at a time of balance that may come before a clear price change.
Summary
Alnylam Pharmaceuticals shows a stock where strong fundamental growth numbers meet a technical chart formation hinting at a possible turning point. The company's shift to profitability and its outstanding revenue and earnings growth make a firm base for the growth investing part of the method. At the same time, the stock's price movement, trading sideways near a clear resistance point, offers a technical structure for entry, giving a careful method that focuses on both what to buy and when it might be helpful to think about it.
For investors wanting to use this joined fundamental and technical method to find like chances, you can look for more possible picks using the Strong Growth Stocks with Good Technical Setup Ratings screen.
Disclaimer: This article is for information only and does not make financial guidance, a suggestion, or a deal to buy or sell any security. Investing includes risk, including the chance of losing the original investment. You should do your own study and talk with a skilled financial guide before making any investment choices.