
For investors looking to join strong growth possibility with careful risk control, the method created by Mark Minervini offers a notable structure. This process, called the Specific Entry Point Analysis (SEPA) strategy, methodically finds stocks showing firm technical uptrends, solid fundamental improvement, and visible catalysts. It stresses buying strength, not weakness, by concentrating on stocks already in a verified Stage 2 advance. A main part is the Minervini Trend Template, a precise technical checklist confirming a stock is in a firm uptrend before review. When this technical firmness is combined with a company showing high growth speed, marked by improving earnings and sales, the setup can be especially strong for growth-focused investors.
APPLIED OPTOELECTRONICS INC (NASDAQ:AAOI) offers a present example that seems to match several parts of this strategy.
Technical Match with the Minervini Trend Template
A central idea of the Minervini philosophy is to trade in the direction of the main trend, which is clearly set by his Trend Template. APPLIED OPTOELECTRONICS presently fits these important technical conditions, indicating a firm and sound uptrend.
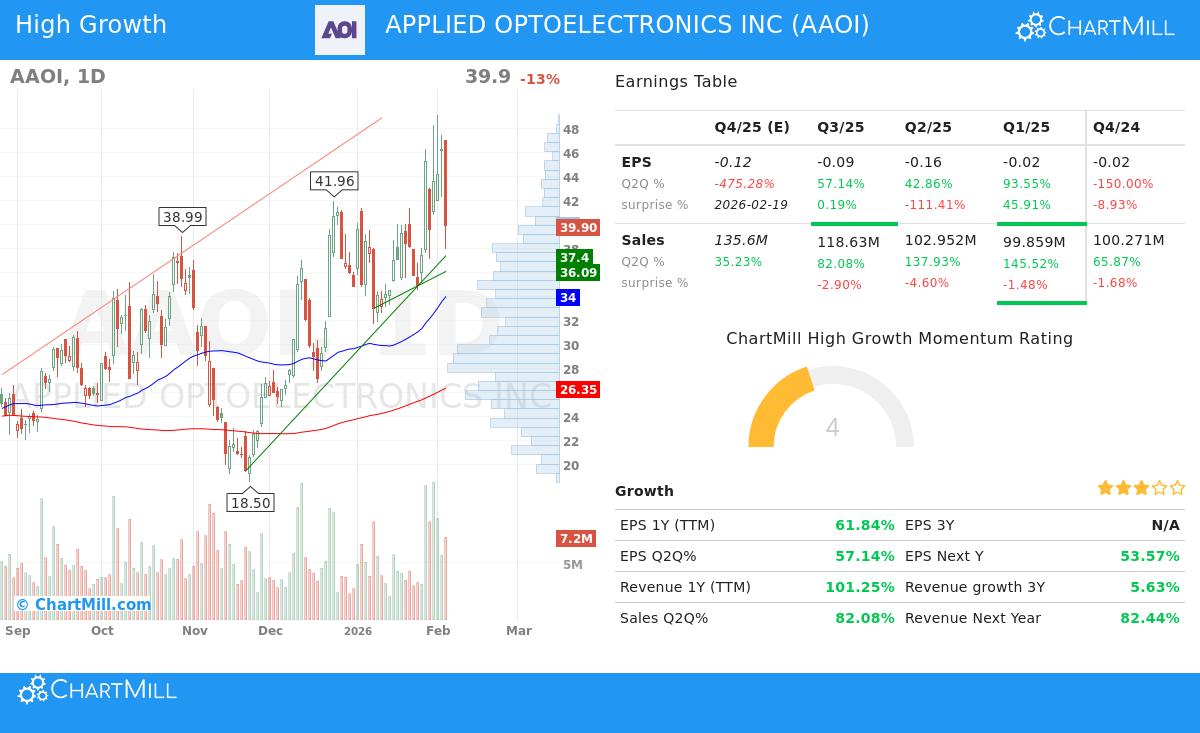
- Price Above Important Moving Averages: The stock's last price of $39.90 trades well above its rising 50-day ($34.00), 150-day ($29.33), and 200-day ($26.35) simple moving averages (SMAs). This order confirms buyer control across short, intermediate, and long-term periods.
- Positive Moving Average Order: The 50-day SMA is above both the 150-day and 200-day SMAs, while the 150-day SMA is also above the 200-day SMA. This "stacked" order is a standard sign of a firm Stage 2 uptrend, showing increasing momentum.
- Nearness to Highs: At $39.90, AAOI is trading within 25% of its 52-week high of $49.11, an important Minervini filter that concentrates on strength and leadership instead of "low-priced" stocks. Also, the present price is over 300% above its 52-week low of $9.71, showing a major recovery and basic momentum.
- Better Relative Strength: With a ChartMill Relative Strength (CRS) score of 90.04, AAOI is doing better than about 90% of all stocks. Minervini regularly notes that market leaders show high relative strength, as it points to institutional demand and sector leadership.
This technical view suggests AAOI is not only going up, but doing so with the kind of organized, wide-based strength the Trend Template is made to find.
Fundamental Signs of High Growth Speed
While the Trend Template makes sure a stock is technically sound, the SEPA strategy needs fundamental fuel for the move. The High Growth Momentum (HGM) rating, which looked for a score of at least 4, tries to find companies with improving business results. AAOI's recent fundamentals show several high-growth traits, though with some mixed signs that call for close look.
Noticeable Strong Points:
- Strong Top-Line Growth: The company's revenue growth on a trailing twelve-month (TTM) basis is notable at over 101%. Recent quarterly sales growth numbers are even more striking, with the last two reported quarters showing year-over-year gains of 137.9% and 145.5%, in order. This improvement in revenue is a main force for growth investors.
- Earnings Path Improvement: After a time of losses, the EPS growth on a TTM basis has turned clearly positive, up 61.8%. The most recent quarter showed a 57.1% gain in EPS compared to the same quarter last year, showing the revenue rise is starting to reach the bottom line.
Points for Care & Setting:
- Analyst View and Future Projections: A major difference appears in analyst expectations. While recent reported results are firm, the average projection for next year's EPS has been adjusted down by over 62% in the last three months. In the same way, the projection for next quarter's EPS growth is deeply negative. This suggests analysts are taking a more careful view of the continuation of the present strong growth rate.
- Profitability Measures: The company's earnings per share on a TTM basis stays negative at -$0.29, and free cash flow is also negative. This points out that the story is one of a fast growth and recovery play rather than settled, profitable growth.
For a Minervini-style investor, the mix of recent, improving fundamental results (the "catalyst") with a clean technical trend is central. The major revenue improvement acts as a possible catalyst that has drawn buyer notice, as seen in the firm price trend. However, the strategy also includes careful manual review, and the conflicting signs between recent results and forward projections would be an important point for more detailed check into the company's view and competitive place.
Technical Soundness Summary
The given technical report gives a measured summary of AAOI's chart soundness. It gives the stock a complete Technical Rating of 10 out of 10, noting firm positive trends in both the short and long term. The report confirms the stock is trading in the higher part of its yearly range and is a top performer relative to the wider market.
The Setup Quality Rating is a fair 6, showing the stock has been moving within a range ($31.67 - $49.11) after its earlier advance. This movement is a needed process that can build force for a possible next step up. The report finds several support zones below the present price, with the closest main support grouped around the $34.88-$34.97 area, which matches with important moving averages. You can see the full, detailed technical analysis here: AAOI Technical Analysis Report.
Locating Like Possibilities
APPLIED OPTOELECTRONICS shows how the meeting of a strict trend-following template and filters for fundamental momentum can reveal possible choices. Investors curious about using this combined method to the present market can examine the preset filter that found AAOI.
Find more stocks that fit both the Minervini Trend Template and High Growth Momentum conditions by using this filter setup: High Growth Momentum + Trend Template Screen.
Disclaimer: This article is for informational and educational purposes only. It is not a recommendation to buy or sell any security. The analysis is based on provided data and a specific investment methodology for illustrative purposes. All investing involves risk, including the potential loss of principal. You should conduct your own thorough research, consider your financial situation, and consult with a qualified financial advisor before making any investment decisions. Past performance is not indicative of future results.