
For investors who use charts and price action to guide their choices, a methodical way to spot possible opportunities is important. One such technique involves searching the market for stocks showing both sound basic technical condition and a distinct, usable chart formation. This tactic centers on locating securities that are not only in a verified upward trend but are also moving in a narrow band, hinting a possible breakout could be near. By joining a high technical score with a high setup quality rating, traders try to find times where a stock's momentum is ready to resume, giving a specific entry point with controlled risk.
A recent filter using this method has pointed to ALCOA CORP (NYSE:AA) as a candidate for more review. The aluminum producer's stock seems to match the standards looked for by technical breakout tactics, offering a case study in how these numerical ratings appear on a real chart.
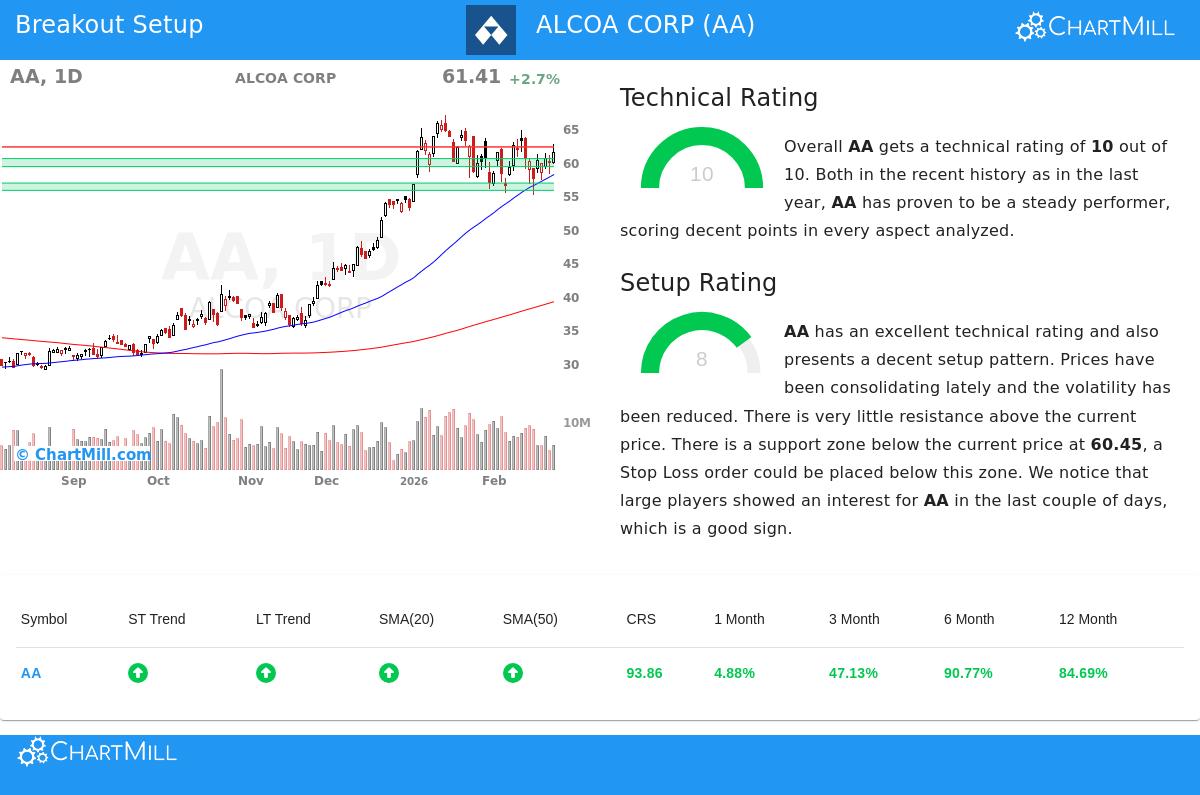
Technical Strength: The Base of the Trend
The first part of this tactic is finding stocks with sound technical condition, which hints a lasting trend is active. ALCOA CORP does very well here, receiving a complete ChartMill Technical Rating of 10. This highest score is not given easily; it shows condition across various time periods and measures. A look into the full technical report shows the parts of this condition.
- Trend Agreement: Both the near-term and longer-term trends for AA are scored as positive. This agreement is a strong sign, showing upward momentum is present from weekly charts to daily activity.
- Price vs. Moving Averages: The stock is priced above all its main simple moving averages (SMAs), the 20-day, 50-day, 100-day, and 200-day, and each of these averages is itself in a rising pattern. This layered, upward agreement of support levels is a typical sign of a sound upward trend.
- Relative Performance: Maybe most notably, AA's performance over one year puts it in front of about 94% of all stocks. This outstanding relative condition shows it is a market leader, not just rising with a general market wave.
This mix of items supports the highest technical rating. For a breakout tactic, this basic condition is essential; it gives the directional expectation and hints any breakout is more probable to continue in the current trend's path.
Setup Quality: Finding the Entry Area
A sound trend by itself is not a sign to buy. The second vital question is when to enter. A stock can be technically very good but high in price, making a careful entry hard. This is where the ChartMill Setup Quality Rating, which for AA is a high 8, becomes very useful. This score measures if the stock is making a constructive consolidation shape.
The review shows AA has been trading in a consolidation stage, letting volatility calm and bringing the price nearer to key near-term moving averages. This tightening action often comes before a clear move. The setup notes state there is "very little resistance above the current price," while a specific support area exists below. In detail, the report finds a main support area between $59.25 and $60.45, made by a meeting of trendlines and moving averages.
For a breakout trader, this makes a clear plan:
- Entry (Breakout): A move above the closest resistance at $62.19 could be seen as the consolidation ending to the upside.
- Exit/Stop-Loss (Failure): A move below the found support area, near $59.24, would cancel the setup and hint the consolidation might end downward.
The system figures this possible trade has a risk of about 4.8% from entry to stop-loss. The high setup rating confirms this consolidation is tight and well-marked, giving a reasonable place for both an entry signal and a protective stop order, the necessary parts of a risk-controlled trade.
Market Setting and Final Notes
It is useful to note that while AA shows excellent relative condition over a one-year span, it is now trading in the higher part, but not at the peak, of its 52-week range. At the same time, the S&P 500 is close to its own highs. This hints AA may have some room to rise compared to the wider market, which is now in a positive near-term trend itself, adding a helpful supporting factor.
The report also points out notable average trading volume, making sure of liquidity for entry and exit. Also, it notes recent activity from large traders, as seen by volume review, which can occasionally come before a big move.
Find More Possible Setups
The filter that found ALCOA CORP is used each day to sort the market for similar technical chances. Investors searching for other stocks showing a mix of high technical scores and good setup shapes can review the present results using the Technical Breakout Setups screen.
Disclaimer: This article is for information only and is based on a technical, numerical filtering method. It is not investment advice, a suggestion to buy or sell any security, or a support of ALCOA CORP. The described trade setup is made automatically for example. Investors should do their own full study, think about their personal risk comfort, and know about coming company events like earnings reports before making any investment choices. Past results do not guarantee future outcomes.