How to find and trade the Ascending Triangle Pattern
Ascending Triangle Pattern Trading Strategy
The ascending triangle is a base formation. A base formation or consolidation is a pause in the trend where the prices stabilize around certain levels. After the run up some traders and investors start to take profits. When the price can remain in a certain range it means there are enough new buyers to support the profit taking and slowly more and more shares are in the hands of new shareholders. When the price stabilizes the stock becomes more attractive to new and more buyers (most people do not like to buy after several up days) and the stock becomes interesting to technical traders noticing the base formation.
What we now want to see is a breakout above the horizontal resistance line. Depending on the specific chart and your trading style, a stop can be placed below the rising support line or below the horizontal resistance line. (A day trader will typically take a larger position and will have a stop below the low of the day and move the stop during the day already, while a swing/position trader will give more room and see how things unfold in the coming days and weeks).
The chart below gives a full overview of the idea:
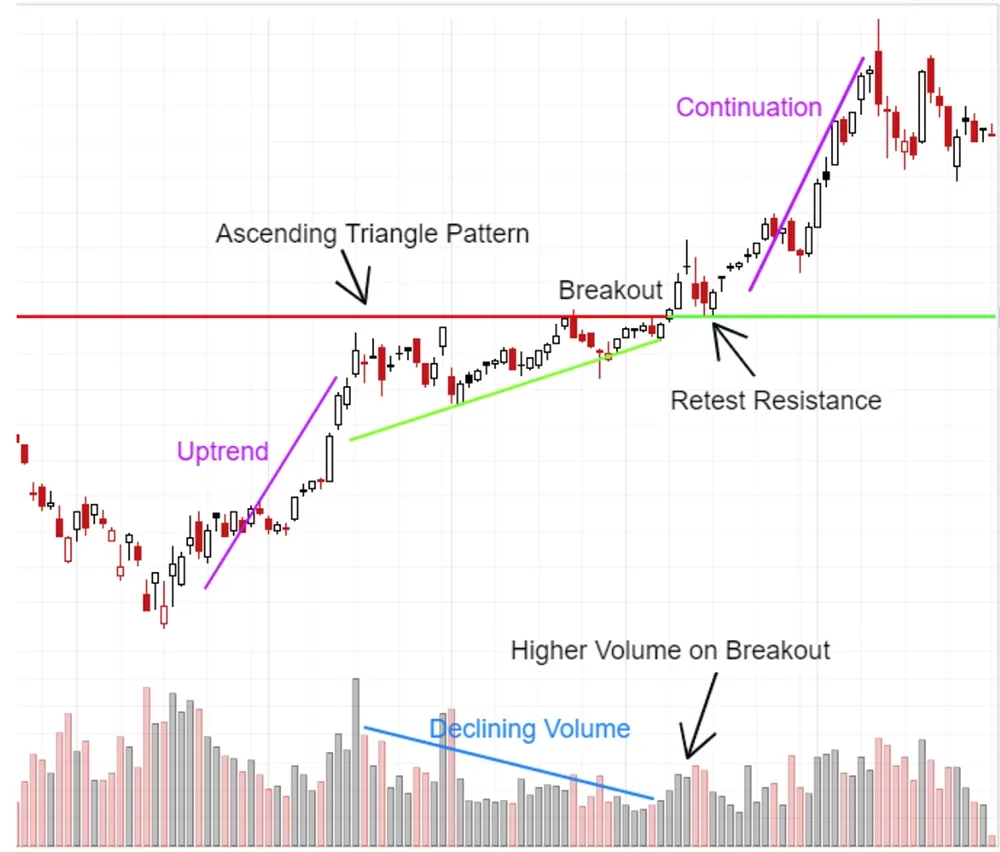
We see:
- An uptrend
- The formation of an ascending triangle pattern, including decline volume during the formation.
- A breakout. The breakout occurs with higher volume, which is always a good sign.
- A retest of the resistance line, which now acts as support
- Continuation of the trend
As always: the chart above shows how we want an ascending triangle to behave. This is what we call text book behavior. However: the formation of an ascending triangle is no guarantee for a continuation of the trend. Anything can happen and when engaging in such a trade we will use stops and money management to make sure our maximum loss is limited.
Ascending Triangle Pattern Stock Screener.
The ChartMill Stock Screener supports finding ascending triangle patterns. On top of that ChartMill will also automatically draw the trendlines which make up the pattern. On the indicators tab you can just select 'Ascending Triangle' from the 'Chart Patterns' filter on the 'indicators' tab. There is a fully configured screen available linked to this article. This is a direct link to the screener.