
For investors using technical analysis to find possible opportunities, the search usually starts with two main questions: which stock is in a solid trend, and when is the best time to enter that trend. A methodical way to answer these questions is to look for stocks that show both good technical condition and a distinct, usable price pattern. One example is the Technical Breakout Setups screen, which selects securities with a high ChartMill Technical Rating, pointing to a solid existing trend, and a high ChartMill Setup Quality Rating, pointing to a pause that might come before a new price move. This pairing tries to find stocks that are not only doing well but are also set for a possible move out of a set price area.
A recent check with this method has pointed to YPF S.A.-SPONSORED ADR (NYSE:YPF) as a candidate deserving more attention. The Argentine energy company, involved in finding, extracting, and delivering oil and gas, is now showing an interesting technical view based on the study.
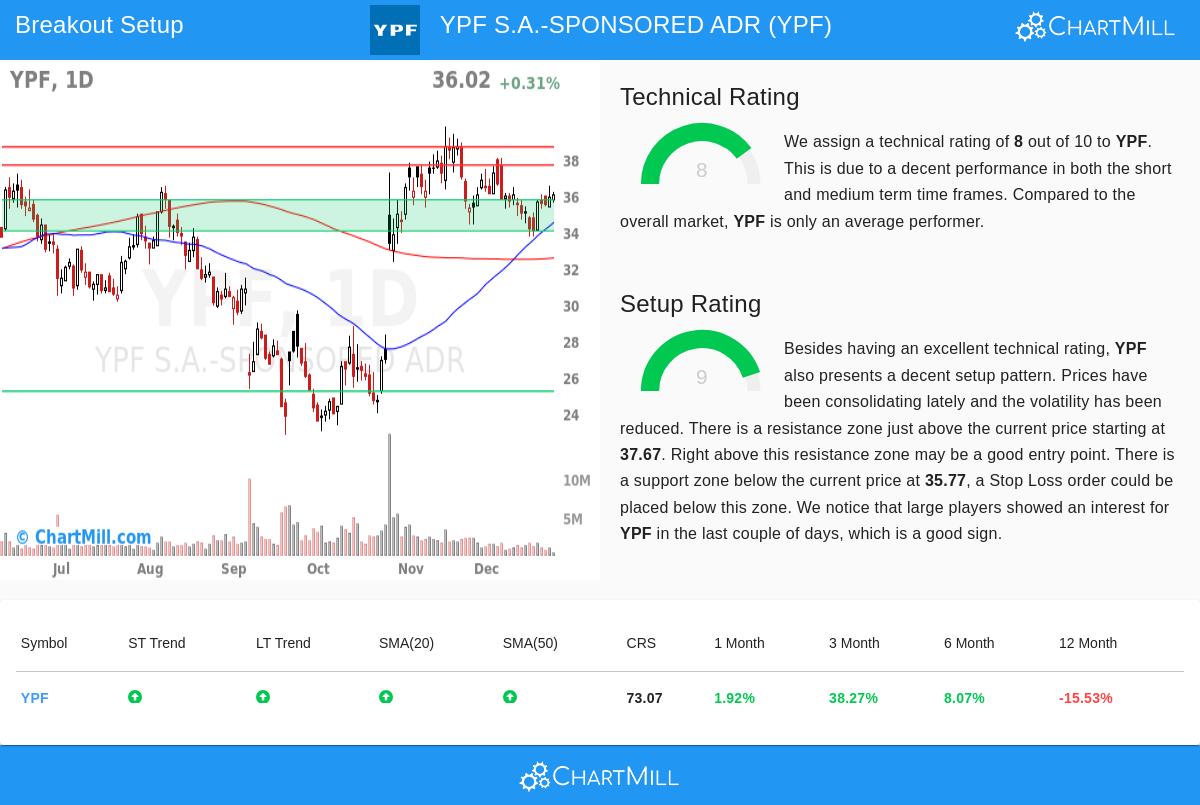
Looking at the Technical Condition
The base of a breakout plan is a stock's existing technical condition. A high Technical Rating implies the stock is in a clear upward trend and is doing better than similar stocks, which is important because starting a trade in a stock with solid momentum raises the chance of a good breakout. YPF's present Technical Rating of 8 out of 10 puts it clearly in positive ground.
A look at the detailed technical report shows several points adding to this score:
- Trend Direction: Both the near-term and longer-term trends for YPF are seen as positive. This agreement across different periods is a solid optimistic sign and a main part of a high technical rating.
- Moving Average Position: The stock is priced above its important moving averages (20, 50, 100, and 200-day SMAs), and all these averages are rising. This arrangement points to continued buying interest and gives a series of possible price floors.
- Comparison to Others: In the Oil, Gas & Consumable Fuels industry, YPF is seen as doing better than 77% of its 210 peers. Also, it has done better than 73% of all stocks in the market over the last year, though the report mentions this condition is mainly from a large move about four months back.
This combined technical condition answers the "which stock" question, marking YPF as a leading stock in its field that is in a clear upward trend.
Looking at the Setup Condition
A solid trend by itself is not a signal to buy; entering a stock that has moved too far can result in quick declines. This is where the Setup Quality Rating is key. It finds times of pause or "close" trading, which can gather force for the next upward move and give clear points for entry and stop-loss orders. YPF's very good Setup Rating of 9 implies such a good pause is now happening.
The technical report gives clear details for this setup score:
- Pause Pattern: The study mentions "less movement while prices have been pausing in the latest period." YPF has been trading in an area between about $33.72 and $38.08 over the last month, and it is now placed in the middle of this area.
- Set Price Floor and Ceiling: The setup finds clear, close levels that are needed for trade planning.
- An important price floor area exists between $34.05 and $35.77, made by a combination of trendlines and moving averages.
- Close price ceiling is found in a tight area between $37.67 and $37.69.
- Suggested Trade Plan: Based on this arrangement, the report describes a possible breakout setup. An entry might be thought about on a move above the price ceiling area at about $37.70, with a stop-loss order placed below the price floor area near $34.04. This sets the trade's possible loss at about 9.7%.
- Supporting Gauge: Adding a level of confirmation, the report notes that large investors, as seen by the Effective Volume gauge, have shown activity in YPF in recent days, which can sometimes come before notable price moves.
This study directly addresses the "when to buy" question, suggesting YPF is not overstretched but is instead holding within an area, waiting for a reason to push past a set price ceiling.
Summary
For technical investors, YPF shows a notable case where solid existing trend measures meet a good, usable price pattern. The high Technical Rating confirms its place as a comparison strength leader, while the high Setup Rating shows it is in a pause that may be close to ending. The set price floor and ceiling levels give a clear structure for handling a possible breakout trade, fitting with a careful technical method.
It is necessary to recall that technical setups show likelihood, not guarantee. The wider market condition, while now positive, and any news about the company must always be reviewed next to chart patterns.
Interested in finding more possible breakout setups like YPF? You can use the same Technical Breakout Setups screen each day to find new opportunities here.
Disclaimer: This article is for information only and is not investment advice, a suggestion, or an offer or request to buy or sell any securities. The study shown is based on technical gauges and should not be the only reason for any investment choice. All trading and investment choices include risk, including the chance of losing the original investment. Readers should do their own study and talk with a qualified financial advisor before making any investment choices.