
XYLEM INC (NYSE:XYL) has been identified as a potential breakout candidate by our technical screening process. The stock shows a combination of solid technical health and a well-defined setup pattern, making it an interesting prospect for traders. Below, we examine the key factors that contribute to its appeal.
Technical Strength
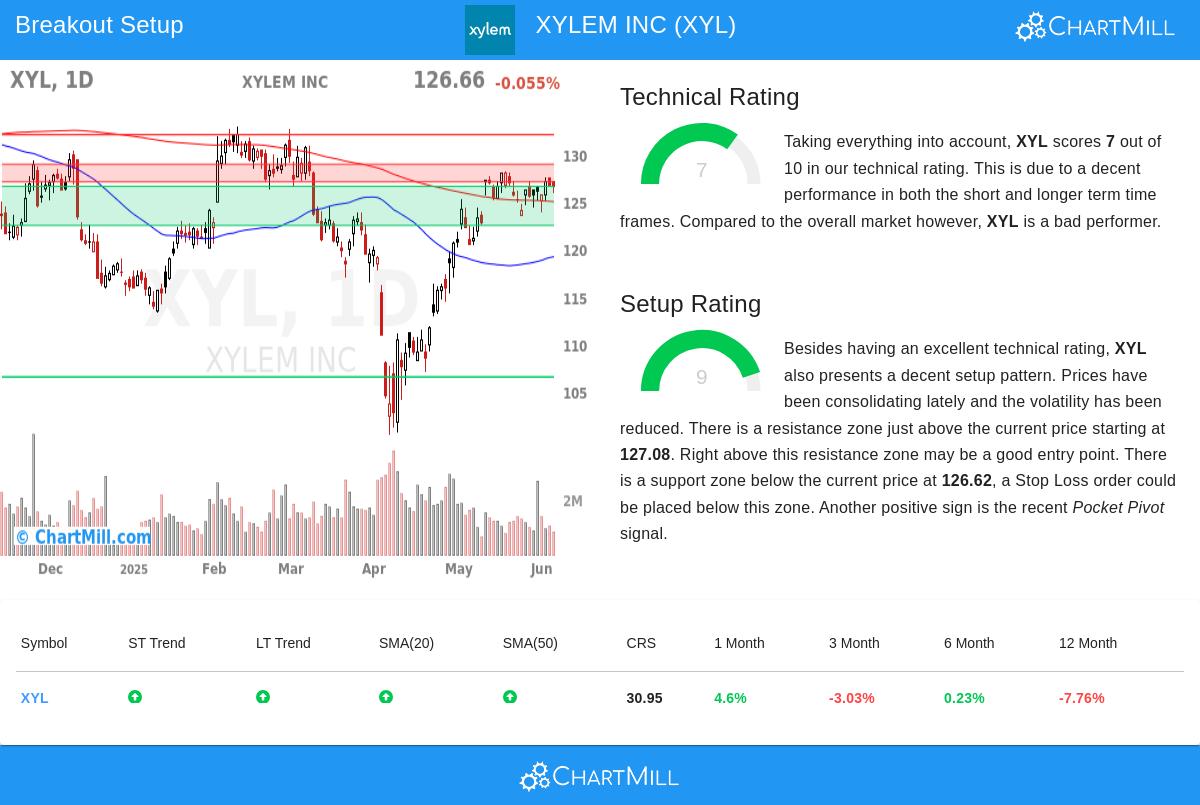
XYL currently holds a Technical Rating of 7, indicating a favorable trend structure. Key observations from the technical report include:
- Positive Trends: Both short-term and long-term trends are upward, reinforcing the stock’s bullish posture.
- Bull Flag Pattern: The stock is forming a bull flag, a continuation pattern that often precedes further gains after a strong upward move.
- Moving Averages: The stock is trading above its 20-day, 50-day, and 100-day moving averages, confirming near-term strength.
Despite lagging slightly compared to the broader market (with only 30% of stocks performing worse year-to-date), XYL’s recent price action suggests improving momentum.
Setup Quality
With a Setup Rating of 9, XYL presents a high-quality consolidation pattern. Key aspects include:
- Tight Trading Range: Over the past month, the stock has traded between $121.39 and $128.20, indicating reduced volatility and a potential base for a breakout.
- Support & Resistance: A clear support zone exists between $122.50 and $126.62, while resistance lies near $127.08 to $128.94. A move above this resistance could signal an entry opportunity.
- Pocket Pivot Signal: Recent accumulation activity suggests institutional interest, adding further credibility to the setup.
Trade Considerations
The technical analysis suggests a possible entry above $128.95, with a stop-loss below $123.56 to limit downside risk. The trade setup implies a 4.18% risk per position, which aligns with disciplined risk management practices.
For more breakout opportunities, explore our Technical Breakout Setups screener, updated daily.
Disclaimer
This is not investment advice. The analysis is based on technical observations at the time of writing, and market conditions can change rapidly. Always conduct your own research before making trading decisions.