
In the world of growth investing, combining a strict technical framework with solid fundamental momentum can be an effective method for spotting possible leaders. One strategy that shows this is the method made famous by trader Mark Minervini, which depends on his Specific Entry Point Analysis (SEPA). This process tries to locate stocks showing strong growth possibility by checking they are in a firm technical uptrend, backed by improving earnings and sales. A useful way to use this is by employing screens that combine Minervini’s Trend Template, a group of technical rules describing a firm uptrend, with filters for strong growth momentum, trying to find companies as their business path and stock price start a major rise.
Woodward Inc. (NASDAQ:WWD), a designer and maker of control solutions for the aerospace and industrial markets, recently came up on such a screening radar. The company’s profile as an important company in aerospace and clean energy infrastructure fits with sectors often ready for growth, but the screen’s main concentration is on the numerical combination of price action and business performance.
Looking at the Technical Base: The Trend Template
Minervini’s Trend Template is made to filter for stocks in a verified Stage 2 advance, skipping those in basing or distribution phases. It needs a particular order of moving averages and price action to verify institutional accumulation and a lasting uptrend. For Woodward, the present technical view shows a strong match with these ideas:
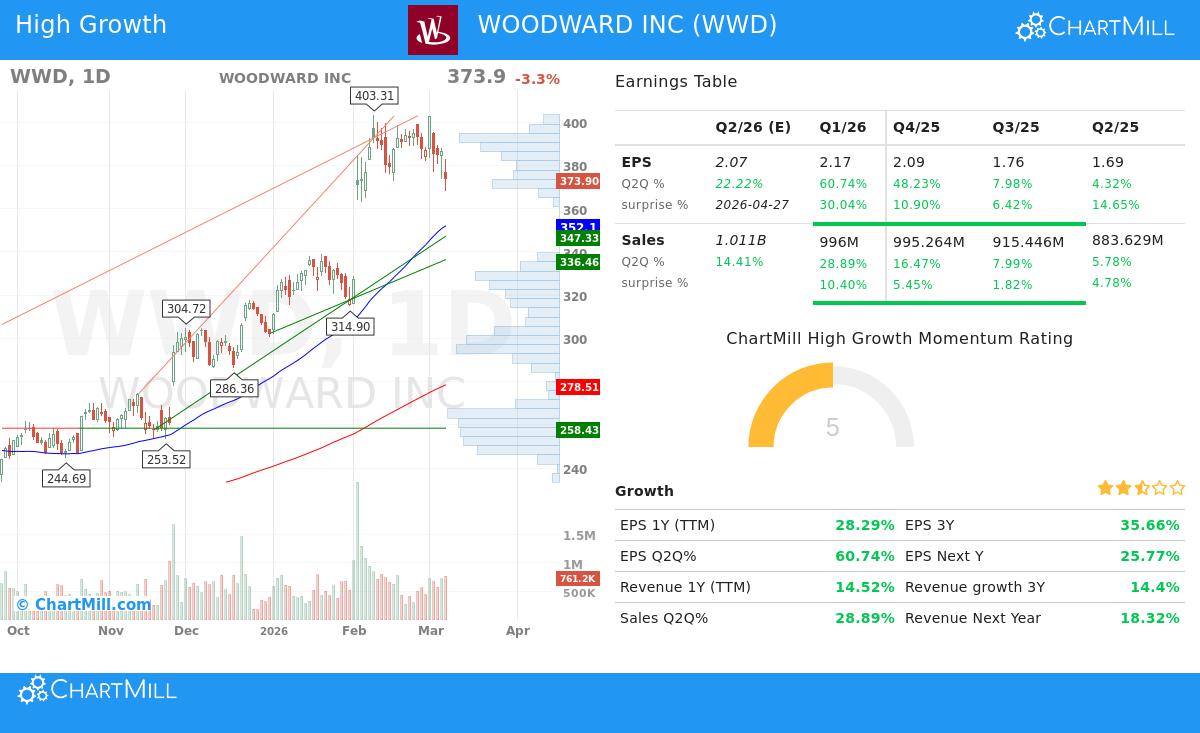
- Price Above Key Averages: The stock’s last price of $373.90 sits well above its rising 50-day ($352.10), 150-day ($291.20), and 200-day ($278.51) simple moving averages (SMAs). This order is a basic part of the template, showing both short-term and long-term bullish momentum.
- Moving Average Order: The 50-day SMA is above both the 150-day and 200-day SMAs, and the 150-day SMA is above the 200-day SMA. This "stacked" order verifies that the trend is firm and arranged across several timeframes.
- Nearness to Highs: A main idea of the strategy is to concentrate on strength, not weakness. Woodward’s price is now within 7.3% of its 52-week high of $403.31 and is a large 155% above its 52-week low of $146.82. This fits the template’s rules of being within 25% of the high and at least 30% above the low, marking its place as a market leader.
- Better Relative Strength: With a ChartMill Relative Strength (CRS) score of 94.76, Woodward is doing better than nearly 95% of all stocks over the past year. Minervini notes that real leaders regularly do better than the wider market, making a high RS score an important filter.
This technical arrangement indicates the stock is in a sound, long-term uptrend, which is the needed background on which Minervini looks for particular entry points, like volatility contractions or breakouts from consolidation.
Checking the Growth Driver: Fundamental Momentum
While the Trend Template makes sure the stock is in the correct technical stage, the "high growth momentum" part of the screen tries to confirm the move with fundamental strength. Minervini’s study shows that the largest stock market winners are almost always backed by firm, and often improving, earnings and sales growth. Woodward’s recent financial numbers show this trait of momentum:
- Earnings Improvement: The company is showing a clear pattern of improving profit growth. Quarterly earnings per share (EPS) growth has jumped from 4.32% a year ago to 60.74% in the most recent quarter. This type of sequential improvement is a strong sign that positive business forces are taking effect.
- Steady Earnings Surprises: Woodward has exceeded analyst EPS estimates in each of the last four quarters, with an average surprise of 15.5%. Positive surprises can push upward revisions and draw institutional interest, acting as a catalyst for more price gain.
- Firm Sales Growth: Revenue growth has also improved, from 5.78% three quarters ago to 28.89% in the latest quarter. Strong top-line growth confirms that demand for the company’s aerospace and industrial solutions is solid.
- Getting Better Profitability: The company’s profit margin has grown noticeably, from 7.97% two fiscal years ago to 12.39% in the last full year. Improving margins show pricing power and operational efficiency, which are signs of a high-quality growth business.
- Positive Analyst Revisions: Analysts have raised their estimates for next year’s earnings by 7.72% over the last three months. Upward revisions are a main part of the SEPA strategy, as they show growing belief in the company’s future and can support continued buying pressure.
Technical Condition and Present Arrangement
According to ChartMill’s own analysis, Woodward has a firm Technical Rating of 9 out of 10, showing its very good long-term trend and market-leading performance. The report states the stock has done better than 94% of the market over the past year and is trading in the upper part of its 52-week range, matching the wider S&P 500.
However, the analysis also gives a note of warning for immediate entry. The stock’s Setup Quality Rating is now a 3, showing that recent price movement has been too unstable to spot a low-risk, high-quality entry point. The stock has been trading in a wide range over the past month and is now near the lower end of that range. For a Minervini-style trader, this indicates a period of consolidation may be required to form a clearer volatility contraction pattern (VCP) before a new best entry point appears. A full breakdown of the technical levels, including support and resistance zones, is available in the full technical report.
Locating Comparable Chances
Woodward Inc. gives a case study of a stock that matches the central ideas of a combined momentum and growth strategy: a firm technical uptrend confirmed by improving fundamental performance. Investors curious about using this systematic method to find other possible candidates can examine the screening settings directly. You can find more stocks that meet this "High Growth Momentum + Trend Template" criteria by using this pre-built screen on ChartMill.
Disclaimer: This article is for informational and educational purposes only. It is not a recommendation to buy or sell any security. The analysis is based on data provided and screening methodologies described. All investing involves risk, including the potential loss of principal. You should conduct your own research and consider consulting with a qualified financial advisor before making any investment decisions.