
The method for finding potential growth stocks often joins strict technical study with an emphasis on fundamental momentum. One organized way is to use Mark Minervini's Trend Template, which sorts for securities showing solid, confirmed uptrends over several periods. This technical base is then combined with a search for high growth momentum (HGM), looking for firms that are not only increasing in price but are also supported by quickening earnings, sales, and favorable analyst changes. This two-step plan works to separate leaders that have both the price force and basic business momentum typical of large market successes.
WisdomTree Inc (NYSE:WT) appears as a present option that meets the main principles of this joined plan.
Technical Force: Matching the Minervini Trend Template
A key part of the Minervini plan is the Trend Template, a group of fixed technical conditions meant to confirm a stock is in a strong Stage 2 climb. WT's present chart shows a clear match with these rules:
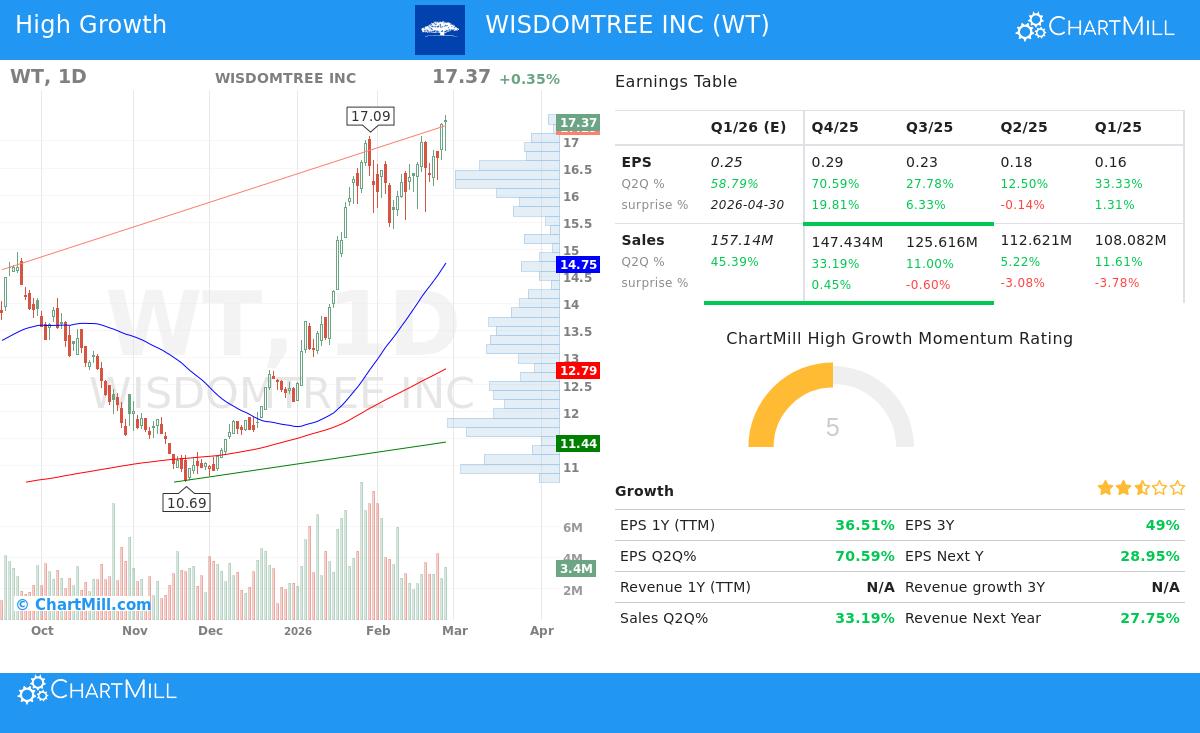
- Trend Match: The stock is trading notably above its main moving averages, with the 50-day ($14.75), 150-day ($13.44), and 200-day ($12.79) averages all in verified uptrends. Importantly, the shorter-term averages are ordered above the longer-term ones (50-day > 150-day > 200-day), a standard mark of a sound, speeding uptrend.
- Nearness to Highs: WT's price of $17.37 is within 1% of its 52-week high of $17.48, satisfying the template's need to be within 25% of the high. At the same time, the price is more than 130% above its 52-week low of $7.47, well past the 30% limit. This shows continued force and a strong recovery trend.
- Market Leadership: With a ChartMill Relative Strength (CRS) score of 94.5, WT is doing better than almost 95% of all stocks in the market. High relative strength is a vital filter in the Minervini process, as it finds sector and market leaders that usually draw institutional money and lead gains.
This technical view indicates WT is not simply recovering but is in a clear, leadership-grade uptrend, the precise setting the Trend Template aims to use.
Fundamental Momentum: The Argument for High Growth
While the chart displays the "what," fundamental growth numbers explain the "why." WT's recent financial results show the sort of speeding momentum that high-growth investors and the Minervini method focus on.
- Earnings Speed Increase: The firm has shown major year-over-year earnings per share (EPS) growth. The latest quarter presented a strong rise of 70.6%, a marked speed increase from the 27.8% growth seen in the previous quarter. This sequence of getting better quarterly growth rates is a main sign of fundamental momentum.
- Analyst Trust: The market's forward-looking view is also good. Analyst estimates for WT's earnings next year have been adjusted higher by 4.8% over the last three months. Such upward adjustments often come before continued price force as improving hopes attract new investors.
- Profitability and Cash Flow: The company keeps sound profitability, with a profit margin of 15.1% in the last quarter. More notably, its free cash flow per share has jumped over 111% in the past year, showing solid operational health and financial ability to support future growth or give capital back to shareholders.
These numbers back the high growth momentum grade, suggesting the technical move higher is supported by real business results rather than speculative excitement.
Technical Condition and Setup Summary
ChartMill's own study gives a combined view of WT's technical position. The stock gets a complete Technical Rating of 10 out of 10, reflecting outstanding condition across long- and short-term trend signals, moving average order, and relative strength. The short-term and long-term trends are both graded as positive, a strong mix.
The Setup Rating is a firm 7, showing that after its strong rise, the stock is in a time of consolidation. The study notes trading inside a set band over the past month, with present price action close to the top of that band. This can form a possible setup for a new momentum move if the stock can clearly move past nearby resistance. The technical report finds key support areas and notes notable buying interest from large participants recently, which can be a sign of more progress.
For a detailed look at the support, resistance, and a sample trade setup, readers can see the full ChartMill Technical Analysis report for WT.
Locating Comparable Chances
WT shows the kind of security that passes through a filter mixing trend-following and growth momentum conditions. Investors aiming to systematically search for other options that meet this strict way can examine the preset screen. You can find more results from this 'High Growth Momentum + Trend Template' screen here.
Disclaimer: This article is for informational and educational purposes only. It is not intended as investment advice, a recommendation, or an offer to buy or sell any security. The study is based on given data and includes a specific investment plan for example. Investors should do their own complete research, think about their financial position, risk tolerance, and investment goals, and talk with a qualified financial advisor before making any investment decisions. Past performance is not a guide to future results.