
For technical investors aiming to find stocks ready for their next rise, a frequent approach uses two main ideas: trend strength and entry timing. The aim is to locate stocks that are both in clear, sound uptrends and also moving sideways in a narrow band, giving a defined and lower-risk chance to enter for a possible push higher. This process removes weak, declining stocks and steers clear of buying into steep climbs, concentrating on leading stocks that are resting before possibly continuing their climb.
Williams Cos Inc (NYSE:WMB), a large energy infrastructure company centered on natural gas transportation and processing, now shows a picture that fits this push higher approach. An examination of its technical measures shows a mix of sound basic strength and a positive price formation.
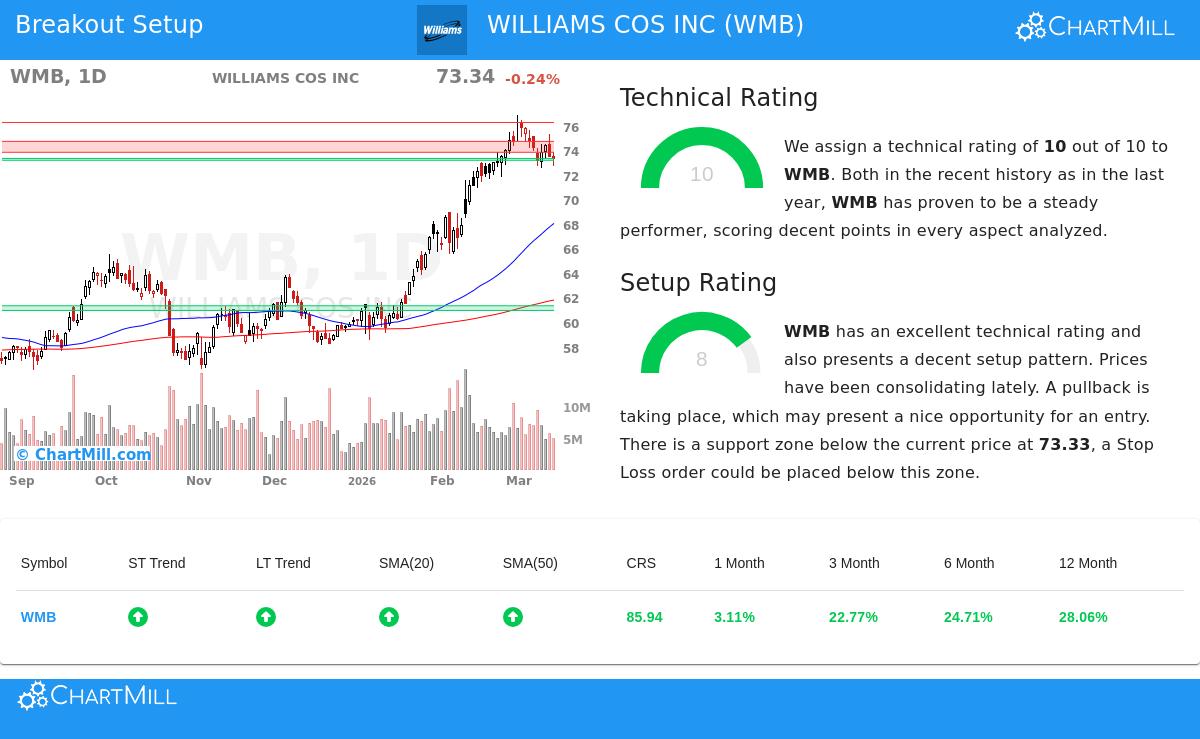
Technical Strength: A Base of Leadership
The main screen in a push higher approach is finding stocks with better technical condition, as a sound basic trend raises the chance that a push higher will work. Williams Cos does very well here, receiving a top ChartMill Technical Rating of 10. This number measures the stock's technical condition by studying items like relative strength, trend path, and moving average agreement across several time periods.
A close look at the technical report for WMB shows the supports of this top rating:
- Trend Agreement: Both the near-term and longer-term trends for WMB are labeled positive. This agreement across time frames is a strong sign of continued buying interest and an absence of notable selling.
- Market Beating Performance: The stock is performing better than 85% of all stocks in the market over the last year, putting it clearly in the leading group. This relative strength is a key part for a push higher candidate, as leaders often keep leading.
- Moving Average Backing: The stock's price is above all its main simple moving averages (20, 50, 100, and 200-day), and each of these averages is itself in a rising pattern. This layered, positive agreement of moving averages works as a set of changing support levels.
This outstanding technical rating answers the "which stock" question for a trader, verifying that WMB is a market leader with a high-likelihood trend. Without this basic strength, any sideways formation would have much more risk.
Setup Quality: Locating the Entry Area
A strong trend by itself is not a buy signal; entering after a fast climb can lead to quick declines. The second part of the approach centers on timing, looking for times of sideways movement or narrow trading bands that give a clear risk point. Williams Cos now displays a ChartMill Setup Rating of 8, pointing to a good-quality sideways formation.
The setup rating judges items like nearness to moving averages, recent price tightening, and the existence of set support areas. For WMB, the examination points out a positive setup:
- Bull Flag Formation: The technical report states that WMB is now showing a bull flag formation. This is a continuation formation where prices decline slightly in a narrow band after a strong climb, often coming before the next upward move.
- Set Support and Resistance: The examination notes specific technical levels. A nearby support area is marked between $73.18 and $73.33, made by a meeting of trendlines. Directly above, a resistance area is between $73.83 and $74.72. This close fight between support and resistance builds the chance for a clear push higher.
- Sideways Movement Within the Trend: The recent trading action shows a pause or slight decline inside a much bigger uptrend, as shown by the 12-month gain of over 28%. This lets the stock reduce overbought conditions while keeping its positive structure.
The high setup rating deals with the "when to buy" question. It indicates the stock is not overstretched but is instead tightening in a set band, letting traders plan an entry above resistance with a protective stop-loss order set below the nearby support area, clearly setting and limiting risk.
A Specific Trading Example
From this technical and setup examination, a sample trading plan is created. It proposes a possible entry on a push above the resistance area at $74.73, with a stop-loss order set at $73.17, just under the support area. This would create a risk of about 2.1% on the trade itself. It is key to know this is an example taken from the automated examination of support and resistance levels. Traders must always change such details to match their own risk comfort, time frame, and total market view.
Locating Other Chances
The process used to find Williams Cos as a push higher candidate can be used in a standard way to the wider market. Investors searching for other stocks displaying a similar mix of sound technicals and narrow sideways formations can use the same filter.
You can locate today's list of technical push higher setups by going to the Technical Breakout Setups screen. This tool filters the market for stocks with a Technical Rating of 7 or more and a Setup Rating of 7 or more, giving a daily beginning point for more study.
Disclaimer: This article is for information only and is not investment advice, a suggestion, or an offer or request to buy or sell any securities. The trading example shown is an automated example for learning and is not a suggestion. All investing and trading has risk, including the possible loss of principal. Always do your own study, think about your financial position and risk comfort, and talk with a qualified financial advisor before making any investment choices. Past results do not show future outcomes.