
Investors aiming for substantial price gains frequently use a blended method, joining the future-oriented practice of fundamental study with the timing clues of technical study. One tactic that represents this combination is filtering for vigorous growth stocks showing encouraging technical breakout formations. The reasoning is clear: first, find firms with sound and quickening financial condition, earnings, and expansion, the signs of a lasting enterprise. Then, use a technical view to locate those where the price movement indicates large buyer gathering and a possible extension of the upward move, providing a more tactical point to enter. This technique seeks to match the caliber of the core business with positive market movement.
Vertiv Holdings Co-A (NYSE:VRT) appears as a strong prospect from this kind of filtering. The company, a worldwide supplier of essential digital infrastructure technology for data centers and communication systems, works directly in the high-expansion area of digitalization and AI-powered computing need.
Fundamental Strength: The Source for Expansion
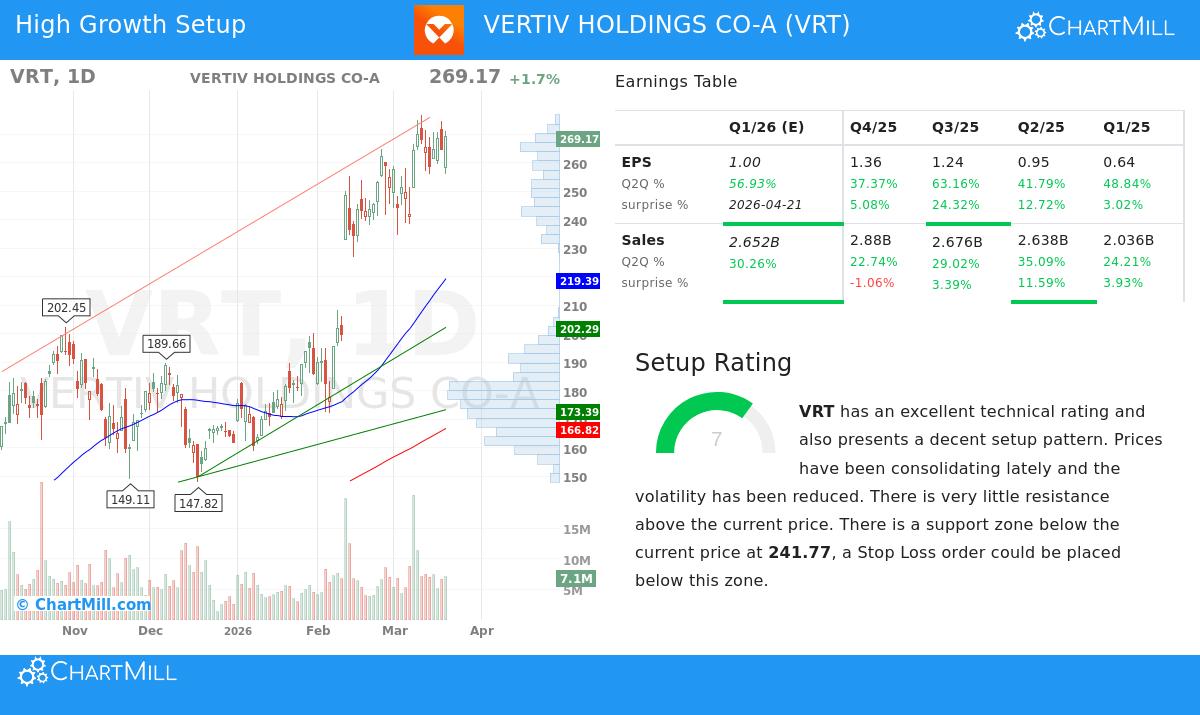
The base argument for Vertiv depends on its exceptional fundamental grades, which point to a firm in a forceful expansion stage while keeping financial control. According to its detailed fundamental analysis report, Vertiv receives a total score of 8 out of 10, with especially high grades in Earnings (9/10) and Expansion (8/10).
Expansion Path:
- Strong Recent Results: Sales increased by 27.69% over the last year, while Earnings Per Share (EPS) rose by a notable 47.02%.
- Continued Force: The company displays a 3-year average yearly EPS expansion of 39.26%, showing this is not a single-period event.
- Future Outlook: Experts forecast ongoing solid expansion, with predicted yearly EPS growth close to 25% and sales growth above 16% in the next years.
Earnings and Financial Condition:
- High Yields: Vertiv shows remarkable capital effectiveness with a Return on Invested Capital (ROIC) of 17.21%, doing better than 96.7% of similar firms in the Electrical Equipment field.
- Growing Margins: Both Operating Margin (18.59%) and Profit Margin (13.03%) lead the field and have been rising steadily.
- Firm Base: With a Financial Condition grade of 8/10, the company indicates a sound financial position. Its Altman-Z score of 9.18 shows very little chance of failure, and its debt is acceptable compared to its large free cash flow production.
This fundamental picture is exactly what expansion investors look for: a firm taking market position in a growing target market, turning revenue into earnings at a rising speed, and doing so from a place of financial soundness. This supplies the needed "quality" context that gives an expansion narrative longevity.
Technical Picture: Matching Price with Possibility
While sound fundamentals describe the possibility, technical study assists in evaluating market feeling and possible entry timing. Vertiv’s technical analysis report shows a price chart that supports its fundamental narrative, getting a complete technical grade of 10/10 and a formation grade of 7/10.
Direction and Force:
- Both the near-term and long-term directions are strongly positive, a main indicator of continued purchase demand.
- The stock is changing hands near its 52-week peak and doing better than 98% of all stocks in the market over the past year, showing clear strength.
- All main simple moving averages (20, 50, 100, and 200-day) are moving up, with the present price above them, affirming the positive formation.
Breakout Formation:
- The report notes a "bull flag" formation, a typical continuation sign. This formation happens when a fast price rise (the pole) is followed by a small, declining consolidation (the flag). It implies the earlier upward direction is probable to continue.
- The formation states that price movement has lately tightened during this consolidation, and there is minimal price blockage above the present level, meaning a open route upward if the breakout happens.
This technical view is important for the tactic because it goes past just finding a good firm to finding a good firm that the market is actively valuing. The strong relative performance and positive formation suggest large investor attention and raise the likelihood that the fundamental expansion narrative is being acknowledged and reflected in the price.
Valuation Setting
No study of an expansion stock is finished without looking at valuation. Vertiv trades at a high level based on standard measures like P/E, which is high compared to the wider S&P 500. Yet, this is common for high-expansion firms. The valuation score of 5/10 in the fundamental report is middle, stating that the high level may be reasonable given the exceptional earnings and predicted expansion speed. The PEG ratio, which includes expansion, indicates a more fair valuation. For expansion investors, the main concentration stays on the expansion speed's ability to continue and quality, with the knowledge that high valuations can remain if expansion keeps matching or beating outlooks.
Summary
Vertiv shows a situation where a forceful fundamental expansion story meets a positive technical position. The company’s strong earnings expansion, high earnings, and sound financial condition give a firm base. At the same time, the stock’s market-leading performance, positive direction formation, and developing bull flag formation imply the movement may have more to go. This match is the central goal of a blended fundamental and technical filtering method: to locate firms where business quality is being affirmed by price movement.
Interested in locating other stocks that match this description of sound expansion joined with positive technical formations? You can use the same filter with our predefined "Strong Growth Stock Technical Setups" screener.
Disclaimer: This article is for information and learning only and is not investment guidance, a suggestion, or a bid or request to purchase or sell any securities. The study shown is based on data and reports accessible at the time of writing and could change. Investors must do their own complete study and think about their personal financial situation and risk comfort before making any investment choices. Previous results do not show future outcomes.