
For investors looking to join solid technical trends with firm fundamental growth, a methodical system can be useful. One such method is the Mark Minervini strategy, which joins a strict technical checklist, the Trend Template, with a concentration on companies showing quickening earnings and sales. This two-step process seeks to spot market leaders early in their growth phases, aiming at stocks that are both in strong uptrends and supported by bettering business fundamentals. The aim is to locate securities where price movement is verified by the company's actual results, possibly presenting a good risk/reward balance for growth-focused investors.
VIKING HOLDINGS LTD (NYSE:VIK) comes forward as a candidate that seems to fit the main principles of this joined method. As a company offering destination-focused cruise itineraries across rivers, oceans, and expeditions, it functions in the healing travel and leisure industry. An examination of its technical state and growth measures indicates it may justify more attention from investors using an orderly growth and movement plan.
Technical Fit with the Minervini Trend Template
The Minervini Trend Template is made to filter for stocks in a verified, lasting uptrend, steering clear of those in resting or falling stages. It uses a sequence of moving average arrangements and price levels to confirm a stock is in a sound "Stage 2" climb. Viking Holdings presently meets these important technical conditions:
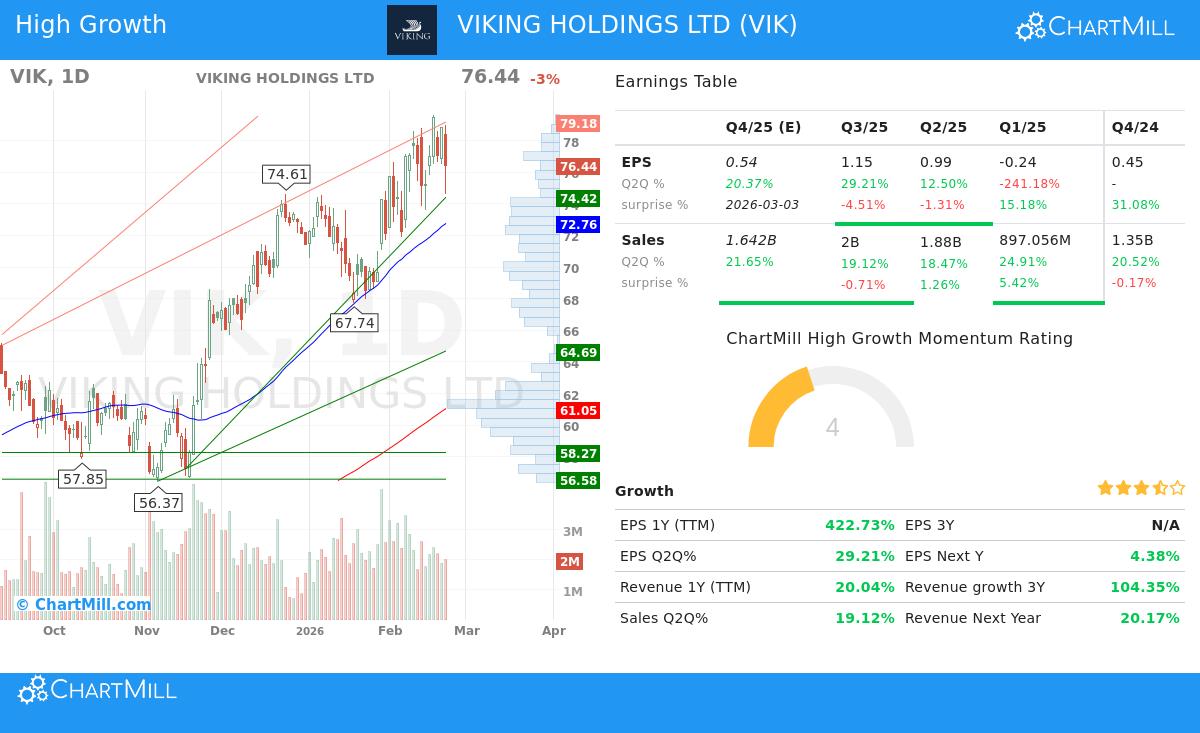
- Trading Above Important Averages: The stock's last price of $76.44 trades well above its rising 50-day ($72.76), 150-day ($64.91), and 200-day ($61.05) simple moving averages (SMAs). This arrangement shows continued buying interest across short, medium, and long-term periods.
- Constructive Moving Average Arrangement: The 50-day SMA is positioned above both the 150-day and 200-day SMAs, and the 150-day SMA is above the 200-day SMA. This ordered bullish stacking of averages is a traditional sign of a firm uptrend.
- Nearness to Highs: With a present price only 3.9% under its 52-week high of $79.62, the stock shows leadership and movement. Minervini's plan stresses that real market leaders often trade close to their highs, not staying far below them.
- Firm Relative Strength: A ChartMill Relative Strength (CRS) score of 88.52 shows VIK is doing better than nearly 89% of all stocks. High relative strength is a foundation of the plan, as it helps spot industry leaders before they are commonly known.
This technical view is also backed by the wider market setting, where the S&P 500's short-term trend is good, giving a helpful setting for trending stocks to keep their climbs.
Fundamental Driver for High Growth Movement
While the Trend Template deals with the "when," the "why" of a stock's move is frequently found in its fundamentals. The High Growth Momentum (HGM) rating tries to spot companies with quickening financial results, a main part in Minervini's SEPA (Specific Entry Point Analysis) method. Viking's recent financial measures show notable growth movement:
- Very Strong Earnings Growth: The company's trailing twelve-month (TTM) EPS has grown by a very large 422.7% year-over-year. Recent quarterly results stay firm, with the last reported quarter showing EPS growth of 29.2% compared to the same time a year earlier.
- Steady Revenue Growth: Top-line growth is sound, with TTM revenue up 20.0%. Quarterly sales growth has been steadily good, recording 19.1% in the most recent quarter, with analyst forecasts expecting over 21% growth for the next quarter.
- Bettering Profitability: A main sign of operational betterment is growing margins. Viking's profit margin in the last quarter was 25.7%, a significant rise from the 23.3% margin in the quarter before and a large betterment from the 7.4% margin reported two quarters prior. This pattern hints at not just growth, but more efficient and profitable growth.
- Earnings Surprise Record: The company has exceeded EPS forecasts in two of the last four quarters, with an average beat of 10.1%. Positive earnings surprises can serve as triggers, drawing institutional attention and pushing further price gains.
This mix of strong earnings recovery, steady revenue increases, and margin growth gives a fundamental reason that backs the stock's firm technical breakout, fitting with the high-growth investor's hunt for companies with clear business movement.
Technical Condition and Setup Evaluation
Beyond the basic Trend Template filters, a close technical study gives view into the stock's present trading position. According to ChartMill's own evaluation, VIK gets a perfect Technical Rating of 10 out of 10, showing very good overall technical condition. Both its long-term and short-term trends are rated as good.
The study also spots a clear support and resistance framework. The stock has been moving in a range between about $68.50 and $79.62 over the past month, forming a base near its highs. This action has produced a Setup Quality rating of 7, showing a fair consolidation shape that may be nearing a conclusion. The main near-term resistance area is seen between $78.80 and $79.45. A clear move above this level could mark the next part of the uptrend, while support lies in a band between $72.31 and $72.76, giving a sensible zone for first stop-loss placement for traders.
A complete breakdown of the technical picture, including marked support and resistance levels, can be seen in the detailed VIK Technical Report.
Locating Like Chances
For investors curious in using this same orderly screen for high-growth movement stocks in confirmed uptrends, the process can be copied. The "High Growth Momentum + Trend Template" screen methodically looks for securities that fit both groups of conditions, trying to separate leaders with both technical and fundamental support.
You can review present results from this screening method here: High Growth Momentum + Trend Template Screen.
Disclaimer: This article is for informational and educational reasons only. It is not a suggestion to buy, sell, or hold any security. The study is based on data and a specific investment method, but past results are not a guide for future results. Always do your own complete research, think about your personal financial position and risk tolerance, and talk with a qualified financial advisor before making any investment choices. Please read our full disclaimer here.