
For investors using a technical breakout method, the aim is to find stocks that are both technically sound and ready for a possible rise. This method usually involves looking for stocks with good underlying trends, showing continued buying interest, that are also moving in a narrow band, which can point to a gathering of force before a breakout. The proprietary ChartMill Technical Rating and Setup Quality Rating are made to measure these two important parts, helping traders decide which stock to review and when might be a suitable time to act.
A recent search using this system has pointed to Viking Holdings Ltd (NYSE:VIK) as a candidate showing these traits. The cruise company, which provides destination-focused river, ocean, and expedition trips, is displaying an interesting technical picture that calls for more review from a breakout viewpoint.
A Detailed Review of the Technical Report for VIK
A look at the full technical analysis report shows the specific measures behind VIK's high scores. The stock's present condition is formed on a base of good trend condition and a favorable price formation.
Technical Condition: A High-Level Rating
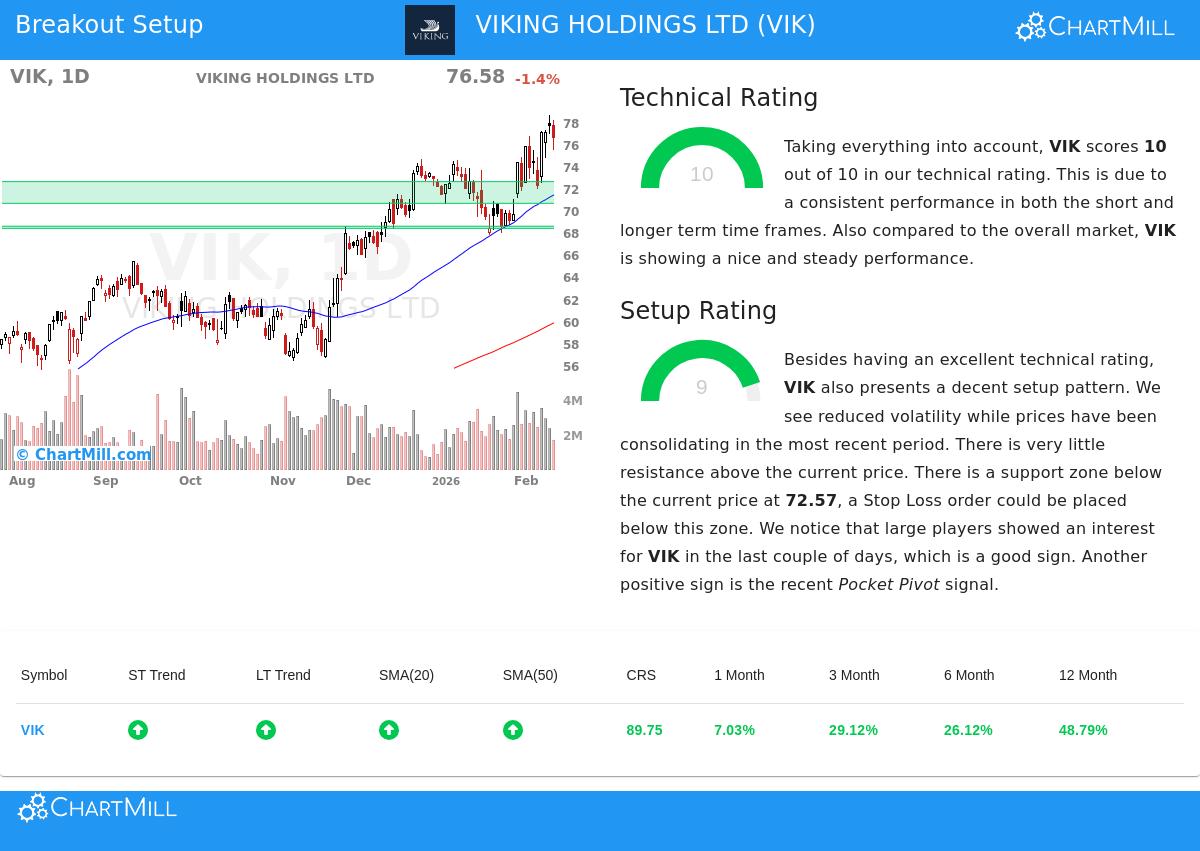
The base of any breakout candidate is a good and set uptrend, which raises the chance that a breakout will follow the existing direction. VIK does well here, getting a complete ChartMill Technical Rating of 10 out of 10. This high score comes from several joining positive points:
- Steady Trend Agreement: Both the long-term and short-term trends for VIK are scored as positive. This agreement across periods points to a united and continued bullish push, a main screen for the breakout method.
- Better Relative Performance: The stock is doing better than 89% of all stocks in the market over the last year and a notable 96% of its group in the Hotels, Restaurants & Leisure industry. This high relative performance is a main part of the Technical Rating and shows a leading position, a wanted quality for breakout trades.
- Good Moving Average Backing: The stock is trading above all its main simple moving averages (20, 50, 100, and 200-day), and each of these averages is itself in a rising pattern. This layered support formation is a standard sign of a sound uptrend.
- Nearness to Highs: VIK is trading close to its 52-week high of $78.59, showing its ability to keep gains and test resistance points.
This mix of points confirms the "which stock" question for the method. A high Technical Rating verifies VIK is not a declining or flat stock, but one with set bullish push, making it a fitting candidate for a continuation pattern.
Setup Condition: Narrow Movement Before a Possible Move
While a good trend is needed, it is not enough for a timely entry. A stock can be technically sound but stretched, giving a poor risk/reward setup. This is where the Setup Quality Rating, which scored a high 9 for VIK, becomes important. It deals with the "when" by finding times of narrow movement.
The report states that VIK "shows a reasonable setup pattern" with prices moving in a narrow band and activity lessening. Main notes backing this score include:
- Set Trading Band: Over the last month, VIK has traded between $67.74 and $78.59. It is now near the top of this band, suggesting it is testing the upper limit of its narrow movement.
- Clear Support Area: The analysis finds a main support area between $70.61 and $72.57, made by a mix of trend lines and moving averages. For a breakout trader, a well-set support level below the present price allows for a sensible placement of a stop-loss order to handle risk.
- Favorable Market Action: The report points to positive signs within the narrow movement, including attention from large participants (as measured by the Effective Volume indicator) and a recent "Pocket Pivot" sign, a price/volume pattern often linked to gathering.
This setup suggests the stock is tightening within its uptrend. The lessened activity and close trading near highs can come before a clear move. The method depends on entering if the stock moves above the recent narrow movement high, with a stop placed below the found support, making a set risk measure.
Combining the Parts: An Example Trade Plan
From this analysis, the technical report suggests a possible trade setup. It puts forward an entry at $78.60, a buy-stop order just above the recent 10-day high, expecting a breakout from the narrow movement. The suggested exit (stop-loss) is at $71.09, placed below the main support area, which would mean a risk of about 9.55% on the trade. It is important to know this is an automated example for explanation. Traders must always do their own analysis, change entries and stops to fit their own risk comfort, and know outside points like coming company news or earnings reports.
Finding Like Chances
VIK shows the kind of chance the Technical Breakout screen is made to find: a stock with high technical condition forming a useful pattern. For investors wanting to see other stocks that now meet like strict rules for trend strength and setup condition, the live results of the screen can be seen here.
Disclaimer: This article is for information only and does not make investment advice, a suggestion, or an offer to buy or sell any security. The analysis is based on technical data and automated scoring models. All trading and investment choices involve risk, including the possible loss of principal. Readers should do their own research and talk with a qualified financial advisor before making any investment choices.