
For investors looking for a structured method for the market, joining fundamental and technical analysis can give a useful structure. One tactic focuses on finding firms with solid basic business condition and good expansion potential, the signs of a traditional growth stock, while also watching for the price chart to indicate a possible starting moment. This technique tries to match the qualitative narrative of a firm with the quantitative timing of the market. A stock that recently appeared from this kind of joined screening is Veeva Systems Inc-Class A (NYSE:VEEV).
The central thought is simple: first, confirm the company is in good financial shape and increasing its earnings at a pleasing speed. This basic soundness gives the base for lasting long-term price gains. Second, use technical analysis to evaluate the stock's present price movement, searching for formations that hint a period of sideways trading could be finishing and a fresh upward move starting. This two-part method aims to reduce risk by staying away from basically poor companies and trying to start positions as market force changes positively.
Basic Soundness: A High-Quality Growth Picture
A close look at Veeva's fundamental report shows why it meets the first quality and growth checks. The company, a top supplier of cloud software for the life sciences field, shows financial traits that are very pleasing to growth investors.
Financial Condition and Earnings: Veeva's balance sheet is very solid, receiving a leading ChartMill Financial Health Rating of 9 out of 10. This is supported by a perfect solvency situation, the company has no debt, and strong cash availability, with a current ratio of 7.53. This financial strength gives stability and enough means to put money into future expansion without the burden of interest costs.
Also notable is its earnings power, scoring an 8 out of 10. The company regularly turns revenue into profit with great effectiveness.
- Return on Equity (ROE): 12.22%, doing better than 97% of its Health Care Technology industry counterparts.
- Profit Margin: 27.93%, also putting it in the top 3% of the industry.
- Operating Margin: A good 28.88%.
These numbers show not just expansion, but high-quality, profitable expansion, a main difference for lasting long-term results.
Expansion Path: Veeva's growth rating of 7 out of 10 is backed by a good past record and firm forward predictions.
- Past Results: Over the last year, Earnings Per Share (EPS) rose by 23.84%, while revenue went up by 15.96%. The five-year average yearly EPS increase is a notable 24.72%.
- Future Predictions: Analysts forecast continued expansion, with average yearly EPS growth expected at 15.33% and revenue growth at 14.37% for the next years.
While future expansion is thought to slow from its remarkable past speed, it stays firmly in "quite good" area. This mix of excellent financial condition, high earnings, and lasting expansion forms the necessary basic ground for the tactic. You can see all the details in Veeva's fundamental analysis report.
Technical Picture: A Formation Appears
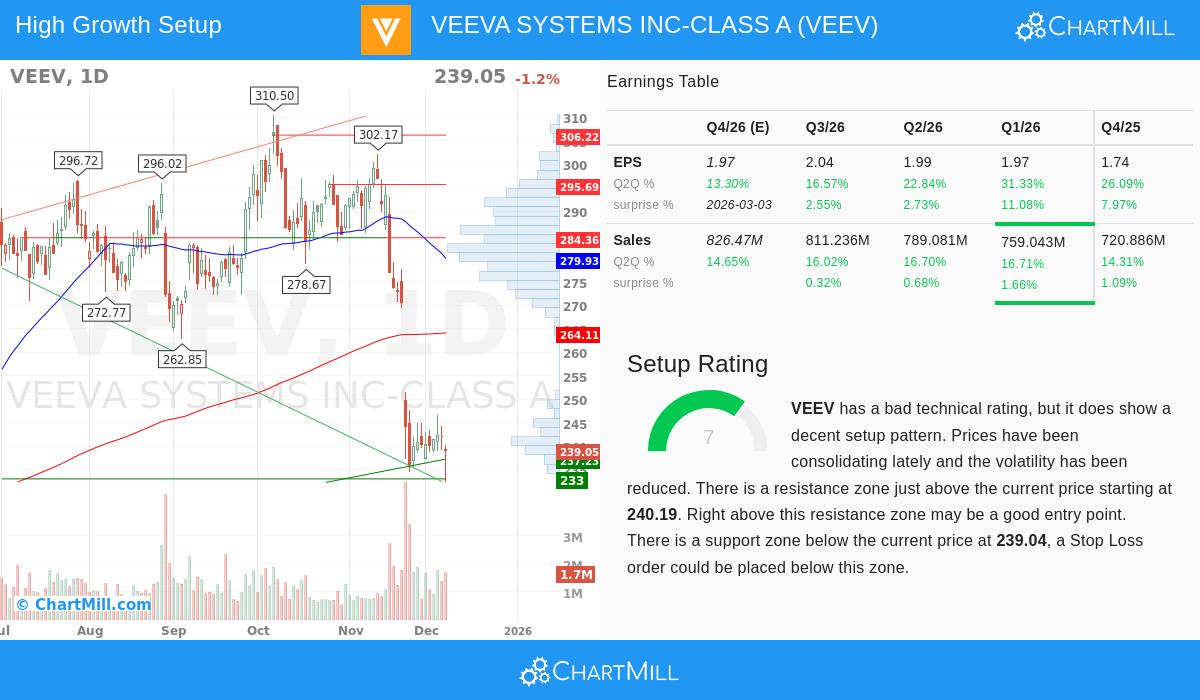
While Veeva's basics draw a picture of a high-quality company, its recent price behavior has been difficult. The stock's technical rating is poor, with both short-term and long-term directions now negative. It has done much worse than the wider S&P 500 over recent months. However, inside this drop, the technical study shows a possibly positive formation developing, leading to a fair ChartMill Setup Rating of 7 out of 10.
The stock seems to be making what technicians name a "bear flag" formation, a consolidation after a fast downward move. While this formation often indicates a continuation of the downward direction, the present setup notes that price swings have lessened as the price has moved sideways. For a possible turn to gain believability, the stock would need to move above a main barrier area.
Main Technical Points:
- Close Barrier: A clear area between $240.19 and $242.29. This zone is made by a mix of trendlines and moving averages. A clear move above this zone could signal that selling force is easing and a fresh upward direction may be beginning.
- Nearby Floor: A floor area exists between $233.00 and $239.04, just under the present price. This gives a sensible point for a protective stop-loss order if the expected upward move does not happen.
This technical setting is key for the joined tactic. The good basics suggest the company's inherent value may not be shown in its recent price fall. The developing consolidation formation gives a clear, objective plan for entry: wait for the price to show force by moving through the noted barrier on good trading volume. This technical signal helps investors avoid buying during a steady drop and instead try to match with a possible change in market feeling. The full technical view is in Veeva's technical analysis report.
Summary: A Choice for a Structured Method
Veeva Systems offers a notable example for the growth-plus-setup tactic. Basically, it meets the important points of excellent financial condition, high earnings, and a continuing expansion driver. Technically, it is coming out of a major drop and is now trading sideways near a floor, with a clear barrier level above that gives a definite mark for a possible change in force.
The investment idea depends on the view that the market may be too negative on a high-quality business because of near-term worries, and a technical upward move could be the sign that this negative view is starting to change. It is a position on the matching of a solid business base with a possible turn in price force.
For investors wanting to see other companies that match this particular method of joining good growth basics with positive technical formations, more findings can be seen by using the Strong Growth Stock Technical Setups screen.
Disclaimer: This article is for information only and does not make investment advice, a suggestion, or an offer to buy or sell any security. The study is based on data and reports from ChartMill, and past results are no promise of future outcomes. Investors should do their own research and think about their personal financial position and risk comfort before making any investment choices.