
The process of identifying stocks with high growth potential often involves a dual approach: finding strong technical trends and confirming basic fundamental strength. One organized method for this joins Mark Minervini's Trend Template with a focus on strong-growth momentum. The Trend Template serves as a technical filter, making sure a stock is in a solid, confirmed uptrend by checking moving average arrangements, nearness to highs, and better relative strength. This technical base is then joined with a review of fundamental improvement, quickly growing earnings, increasing profit margins, and positive analyst changes, to find companies not only going up in price, but doing so because of real business momentum. This article looks at Ubiquiti Inc (NYSE:UI) using this joined view.
Technical Foundation: Aligning with the Minervini Trend Template
A main idea of the Minervini strategy is to trade in the direction of the main trend, focusing money on stocks showing clear technical leadership. The Trend Template gives a fixed group of rules to describe this leadership. Ubiquiti's present chart shows a standard arrangement with these rules, pointing to solid institutional backing and a continued uptrend.
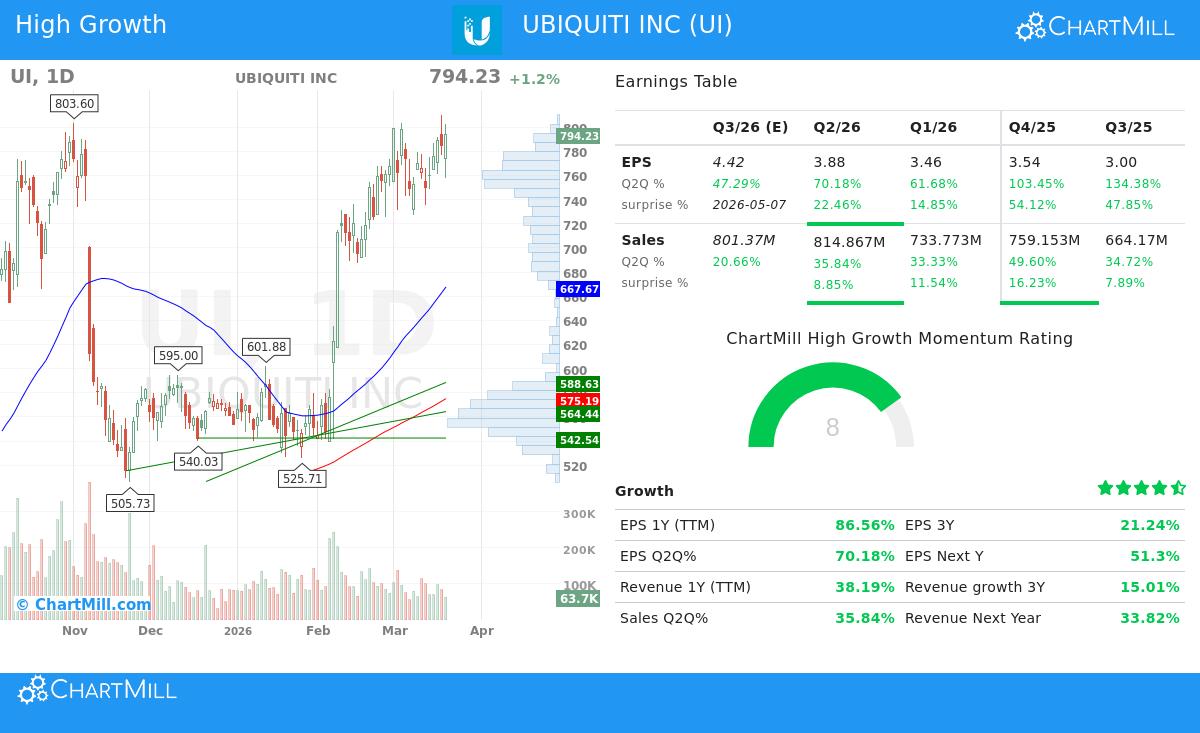
- Moving Average Arrangement: The stock's price is trading well above all main moving averages (50-day, 150-day, and 200-day), and these averages are ordered in the correct bullish order: the 50-day SMA ($667.67) is above the 150-day SMA ($626.48), which is above the rising 200-day SMA ($575.19). This order shows gaining speed across several timeframes.
- Nearness to Highs: UI is trading within 2% of its 52-week high of $810, much better than the template's need to be within 25%. At the same time, the present price is over 210% above its 52-week low, displaying great strength and a solid recovery trend. Minervini notes that real market leaders reach new highs, not rise from lows.
- Better Relative Strength: With a ChartMill Relative Strength (CRS) score of 97.06, UI is doing better than 97% of the whole market. This outstanding relative strength is a key filter in the strategy, as it finds stocks that are leading the market higher, not only following a wave.
This technical view is especially significant given the wider market setting, where the S&P 500's long-term trend is negative. UI’s ability to keep such a solid positive trend against this background further points to its relative strength and possible leadership position.
Fundamental Engine: The High-Growth Momentum Profile
While a solid chart draws notice, continued moves are usually powered by fundamental gain. The High Growth Momentum (HGM) rating judges a company's earnings quality, growth path, and profit steadiness. Ubiquiti's given numbers show a company in a solid fundamental rise, giving the "reason" for the strong price movement.
- High Earnings Growth: The company is showing notable profit increase. Earnings Per Share (EPS) grew 86.6% over the trailing twelve months (TTM). Even more notable is the recent gain on a three-month basis, with the last reported quarter showing year-over-year EPS growth of 70.2%. This form of high, gaining earnings is a sign of Minervini's "superperformance" stocks.
- Increasing Profitability: Growth is being reached not only through higher sales, but through much better efficiency. The profit margin in the last quarter was 28.7%, a large rise from 18.1% in the earlier fiscal year. Rising margins show pricing ability and operational skill, which can lead to fast earnings growth as revenue grows.
- Positive Analyst View: The market's future hopes are rising, as shown by a 28.5% upward change to next year's EPS guesses over the past three months. In the same way, revenue guesses for next year have been changed up by 13.8%. Minervini points out that upward earnings changes often come before more price gain as institutional investors adjust their models.
- Steady Delivery: The company has surpassed both earnings and revenue guesses in each of the last four quarters, with an average EPS surprise of nearly 35%. This steadiness in beating hopes builds trust and can power continued investor belief.
Synthesis: A Strategy-Aligned Candidate
Ubiquiti Inc presents a case where the technical and fundamental stories are in clear agreement. The strict Trend Template rules are met, confirming the stock is in a main Stage 2 uptrend with better market-relative performance. This technical strength is backed by a fundamental profile showing high, good-quality earnings growth, margin increase, and rising analyst hopes. This pairing, a solid trend powered by gaining fundamentals, is exactly what the joined Minervini and high-growth momentum method aims to find.
Technical Analysis Overview
A review of the detailed technical report for UI gives it a complete technical rating of 10/10, showing outstanding health across all judged timeframes. The report notes the stock is showing a bull flag pattern, a pause within an uptrend that often comes before a continued move. Main support is found near $749, with close resistance just above the present price around $794-$798. The study suggests a possible trading plan with an entry on a move above this resistance area, using the support level as a guide for stop-loss placement.
For investors looking for other possible choices that meet this mix of solid technical trends and high-growth fundamentals, the preset screen used to find Ubiquiti can be a useful beginning point. You can view more results from this "High Growth Momentum + Trend Template" screen here.
Disclaimer: This article is for information and learning only. It is not meant as investment advice, a suggestion, or an offer to buy or sell any securities. The study is based on given data and certain methods, but past results are not a sign of future results. Always do your own full research, think about your personal money situation and risk comfort, and talk with a qualified financial advisor before making any investment choices.