
For technical investors, finding stocks that are in a solid uptrend and may be ready for their next upward move is a primary task. One way to address this is by using a method that looks at both the basic technical condition of a stock and the state of its present price formation. This approach centers on locating stocks with a high "Technical Rating," showing a solid and confirmed uptrend, and a high "Setup Rating," which points to a positive pause that might come before a new upward move. By selecting stocks that rate well on both specific measures, traders try to find chances where trend force and timing come together.
TENARIS SA-ADR (NYSE:TS) recently appeared from this kind of scan, showing a picture that justifies more attention from a technical viewpoint. The company, a large producer and supplier of steel pipes mainly for the oil and gas industry, seems to be getting notice from investors who use charts.
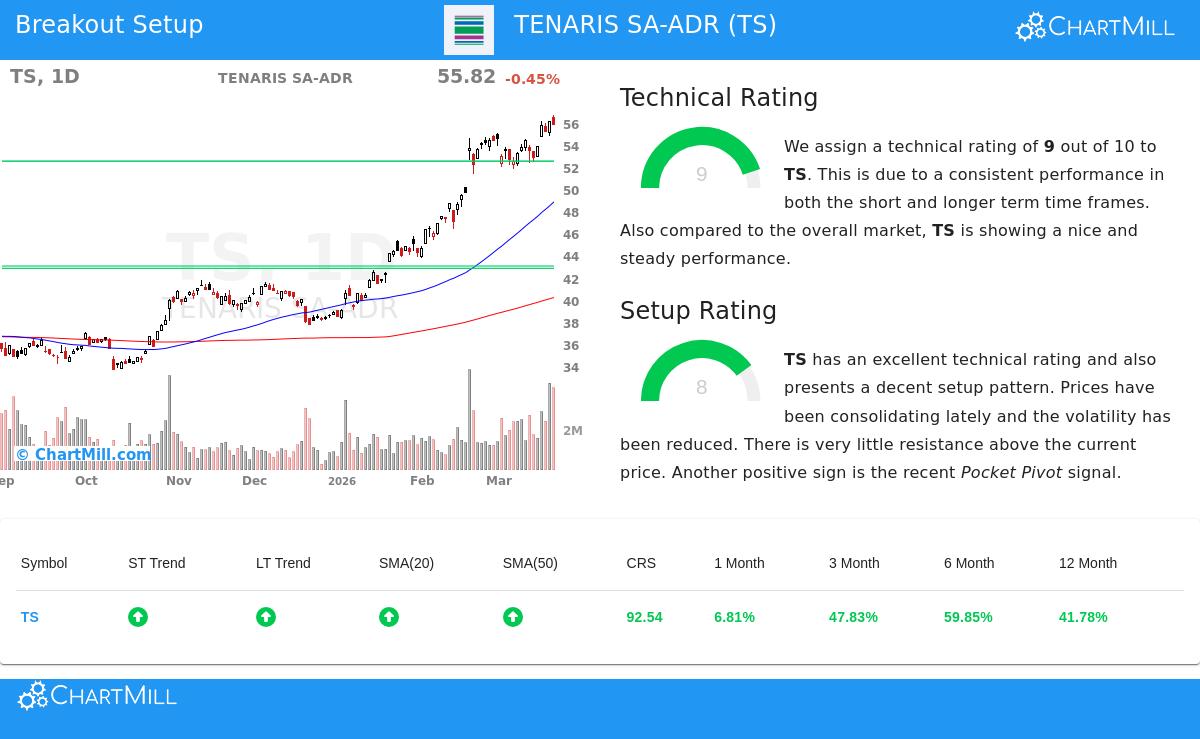
Technical Force: The Base for a Trade
The main screen in a breakout plan is a stock's general technical condition, as a forceful trend supplies the push required for a good price move. Tenaris does very well here, having a ChartMill Technical Rating of 9 out of 10. A close inspection of the technical report shows the supports of this force:
- Trend Agreement: Both the long-term and short-term trends for TS are rated as positive. This agreement across different time frames is a clear mark of a good, continuing rise and lessens the friction that can happen when trends move against each other.
- Market Outperformance: The stock is now trading at a new 52-week high. It is important that, while the wider S&P 500 is not close to its own highs, TS is showing clear outperformance by leading the market, a key feature for breakout possibilities.
- Moving Average Backing: The stock's price is trading above all its main simple moving averages (20, 50, 100, and 200-day), and each of these averages is itself in a rising pattern. This layered, positive arrangement points to broad buying interest over different holding times.
- Performance Numbers: The performance data is strong, with the stock up about 48% over the past three months and almost 60% over the past six. This puts it in the highest group of all stocks on a yearly performance scale.
This high technical rating addresses the "which stock" question for traders, verifying that TS is moving with notable basic push, a necessary condition for the plan.
Setup State: Locating the Entry Area
A forceful trend by itself is not a buy signal; getting in after a fast rise involves risk. This is where the Setup Quality score becomes important, dealing with the "when" to buy by locating periods of pause inside the larger uptrend. Tenaris has a Setup Rating of 8, pointing to a high-grade formation.
- Pause and Lowered Volatility: The report mentions "lowered volatility while prices have been pausing in the latest period." This describes a narrowing price range, which frequently comes before a clear move as supply and demand find a balance.
- Clear Support and Little Price Resistance Above: The examination finds several specific support areas below the present price, giving sensible places for setting protective stop-loss orders. Significantly, it also says there is "very little resistance above the current price," meaning a breakout might meet few near-term barriers to more gains.
- Pocket Pivot Signal: A particular positive signal noted is a recent "Pocket Pivot," a formation marked by an upward price move on volume greater than the largest down volume in the previous ten days. This is often seen as quiet, institutional buying during a pause.
This setup state is what makes the present chart formation usable. It indicates the stock is halting to gather force inside its strong uptrend, giving a possible entry place with a set risk point, instead of being stretched too far.
An Example Trading Plan
Using this technical and setup examination, the report describes a sample trade idea. It proposes a possible entry on a buy-stop order at $56.70, just above the recent 10-day high, which would confirm a breakout from the pause. A stop-loss order is suggested at $52.11, below a main support level, setting the trade's risk. It is very important to know this is an automated illustration; traders must always change such details to match their own risk comfort and verify the setup fits their own study.
Locating Other Chances
The mix of a forceful trend and a high-grade setup is what technical scans are made to find. Tenaris shows one present instance of this activity in the market.
For investors looking to search for other stocks that fit similar conditions of sound technical condition and timely setup formations, the Technical Breakout Setups screen can be a good beginning point for more study.
Disclaimer: This article is for information only and is not investment advice, a suggestion, or an offer or request to buy or sell any securities. The examination shown is based on technical measures and should not be the only reason for any investment choice. Always do your own research and think about talking with a qualified financial advisor before making any investment. Trading stocks has risk, including the possible loss of money.