
TC ENERGY CORP (NYSE:TRP) was identified as a Technical Breakout Setup Pattern by our stockscreener. Such a pattern occurs when we see a pause in a strong uptrend: after a strong rise the stock is consolidating a bit and at some point the trend may be continued. Whether this actually happens can not be predicted of course, but it may be a good idea to keep and eye on NYSE:TRP.
Zooming in on the technicals.
As part of its analysis, ChartMill provides a comprehensive Technical Rating for each stock. This rating, ranging from 0 to 10, is updated on a daily basis and is based on the evaluation of various technical indicators and properties.
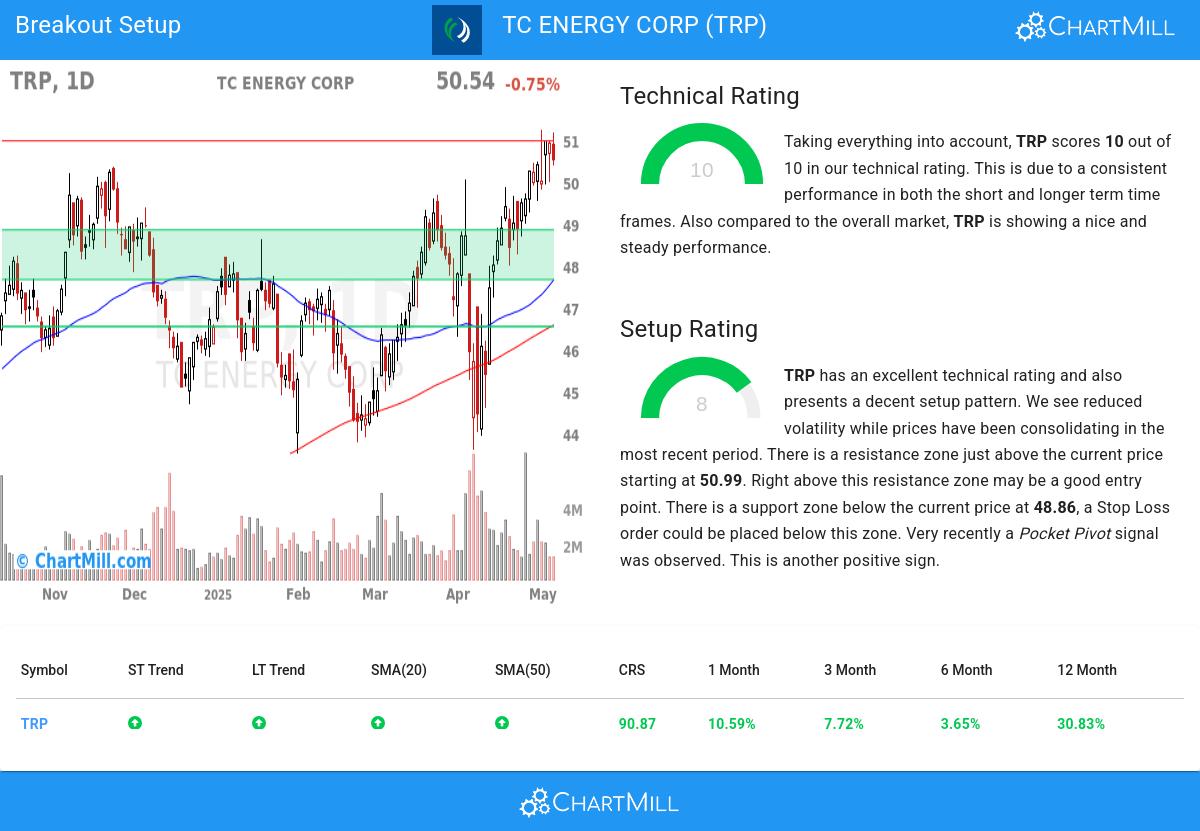
Taking everything into account, TRP scores 10 out of 10 in our technical rating. This is due to a consistent performance in both the short and longer term time frames. Also compared to the overall market, TRP is showing a nice and steady performance.
- Both the short term and long term trends are positive. This is a very positive sign.
- When comparing the yearly performance of all stocks, we notice that TRP is one of the better performing stocks in the market, outperforming 90% of all stocks. We also observe that the gains produced by TRP over the past year are nicely spread over this period.
- TRP is part of the Oil, Gas & Consumable Fuels industry. There are 213 other stocks in this industry. TRP outperforms 91% of them.
- TRP is currently trading near its 52 week high. This is a good sign, certainly because the S&P500 Index is not trading near new highs.
- In the last month TRP has a been trading in the 43.93 - 51.25 range, which is quite wide. It is currently trading near the high of this range.
For an up to date full technical analysis you can check the technical report of TRP
How do we evaluate the setup for TRP?
ChartMill incorporates a Setup Rating in its analysis, which measures the extent of consolidation in a stock over recent days and weeks. This rating, ranging from 0 to 10, is updated daily and takes into account multiple short-term technical indicators. The current setup rating for TRP is 8:
Besides having an excellent technical rating, TRP also presents a decent setup pattern. We see reduced volatility while prices have been consolidating in the most recent period. There is a resistance zone just above the current price starting at 50.99. Right above this resistance zone may be a good entry point. There is a support zone below the current price at 48.86, a Stop Loss order could be placed below this zone. Another positive sign is the recent Pocket Pivot signal.
Trading setups like TRP
One way to play this would be to wait for the actual breakout to happen and buy when the stock breaks out above the current consolidation zone. A possible place for a stop loss would be below this zone.
Please note that this article should not be construed as trading advice. The information provided is solely based on automated technical analysis and serves to highlight technical observations. It is important to conduct your own analysis and make trading decisions based on your own judgment and responsibility.
Every day, new breakout setups can be found on ChartMill in our Breakout screener.
Keep in mind
Important Note: The content of this article is not intended as trading advice. It is essential to perform your own analysis and exercise caution when making trading decisions. The article presents observations created by automated analysis but does not guarantee any trading or investment outcomes. Always trade responsibly and make independent judgments.