
Our stock screener has identified TKO GROUP HOLDINGS INC (NYSE:TKO) as a potential breakout candidate. This technical breakout setup pattern occurs when the stock consolidates after a strong uptrend. While the actual breakout is uncertain, it may be worth keeping an eye on NYSE:TKO.
Technical analysis of TKO
ChartMill employs a sophisticated system to assign a Technical Rating to every stock in its analysis. This rating, which ranges from 0 to 10, is determined by carefully assessing multiple technical indicators and properties.
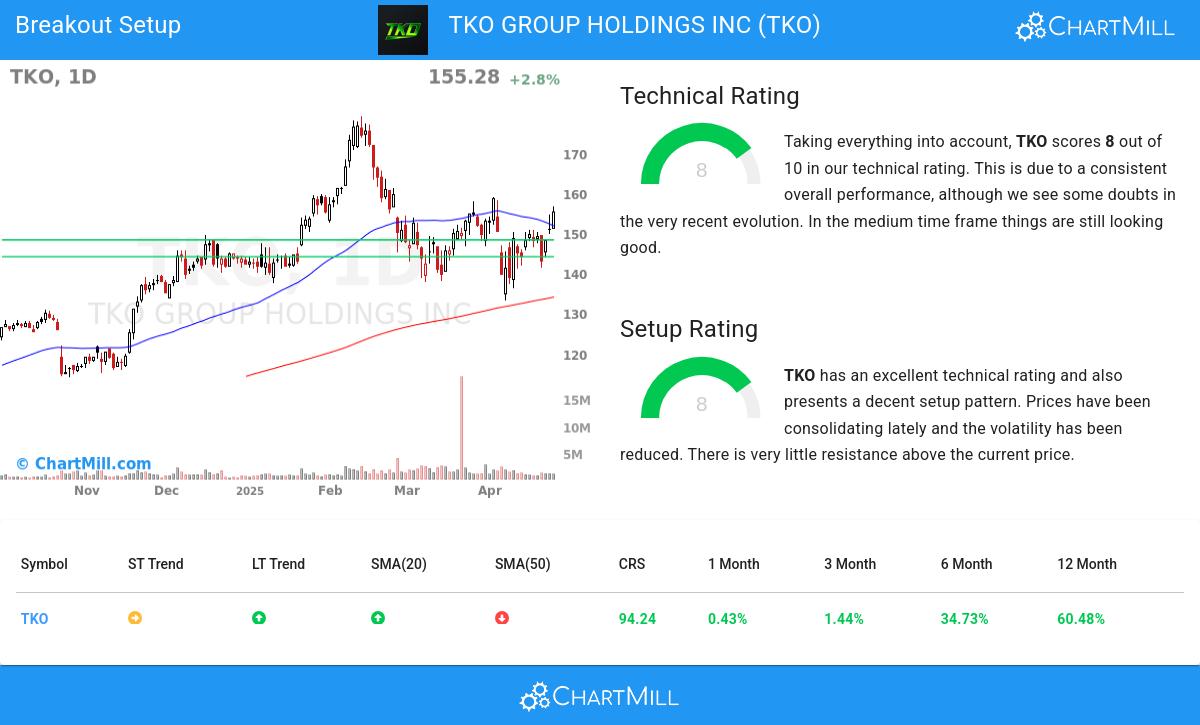
Overall TKO gets a technical rating of 8 out of 10. In the last year, TKO was one of the better performers, but we do observe some doubts in the very recent evolution.
- The long term trend is positive and the short term trend is neutral. The long term trend may just continue or reversal may be around the corner!
- Looking at the yearly performance, TKO did better than 94% of all other stocks. On top of that, TKO also shows a nice and consistent pattern of rising prices.
- TKO is part of the Entertainment industry. There are 72 other stocks in this industry. TKO outperforms 88% of them.
- TKO is currently trading in the upper part of its 52 week range. The market is still in the middle of its 52 week range, so TKO slightly outperforms the market at the moment.
- In the last month TKO has a been trading in the 133.07 - 159.00 range, which is quite wide. It is currently trading near the high of this range.
Check the latest full technical report of TKO for a complete technical analysis.
Looking at the Setup
In addition to the Technical Rating, ChartMill provides a Setup Rating for each stock. This rating, ranging from 0 to 10, assesses the level of consolidation in the stock based on multiple short-term technical indicators. Currently, TKO has a 8 as its setup rating, indicating its current consolidation status.
Besides having an excellent technical rating, TKO also presents a decent setup pattern. Prices have been consolidating lately and the volatility has been reduced. There is very little resistance above the current price.
How can TKO be traded?
A breakout could materialize when the stock breaks out to new highs above the current consolidation zone. One could wait for this to happen and buy when this happens. A stop loss could be placed below the consolidation zone.
Please note that this article should not be construed as trading advice. The information provided is solely based on automated technical analysis and serves to highlight technical observations. It is important to conduct your own analysis and make trading decisions based on your own judgment and responsibility.
More breakout setups can be found in our Breakout screener.
Keep in mind
This article should in no way be interpreted as advice. The article is based on the observed metrics at the time of writing, but you should always make your own analysis and trade or invest at your own responsibility.