
For technical investors, finding stocks that are in a solid uptrend and may be ready for their next rise is a central method. One way to locate these possibilities is by searching for stocks with both a high technical health score and a high setup quality score. The logic is clear: a solid technical rating affirms the stock's existing momentum and trend, while a high setup score shows it is resting in a narrow band, giving a defined and managed entry point for a possible breakout. This pairing aims to sort for market leaders that are pausing before possibly continuing their climb.
TARGET CORP (NYSE:TGT) recently was found on such a search, displaying a profile that technical traders frequently seek. The retailer's stock presents a mix of confirmed strength and a present formation that hints at a possible price movement.
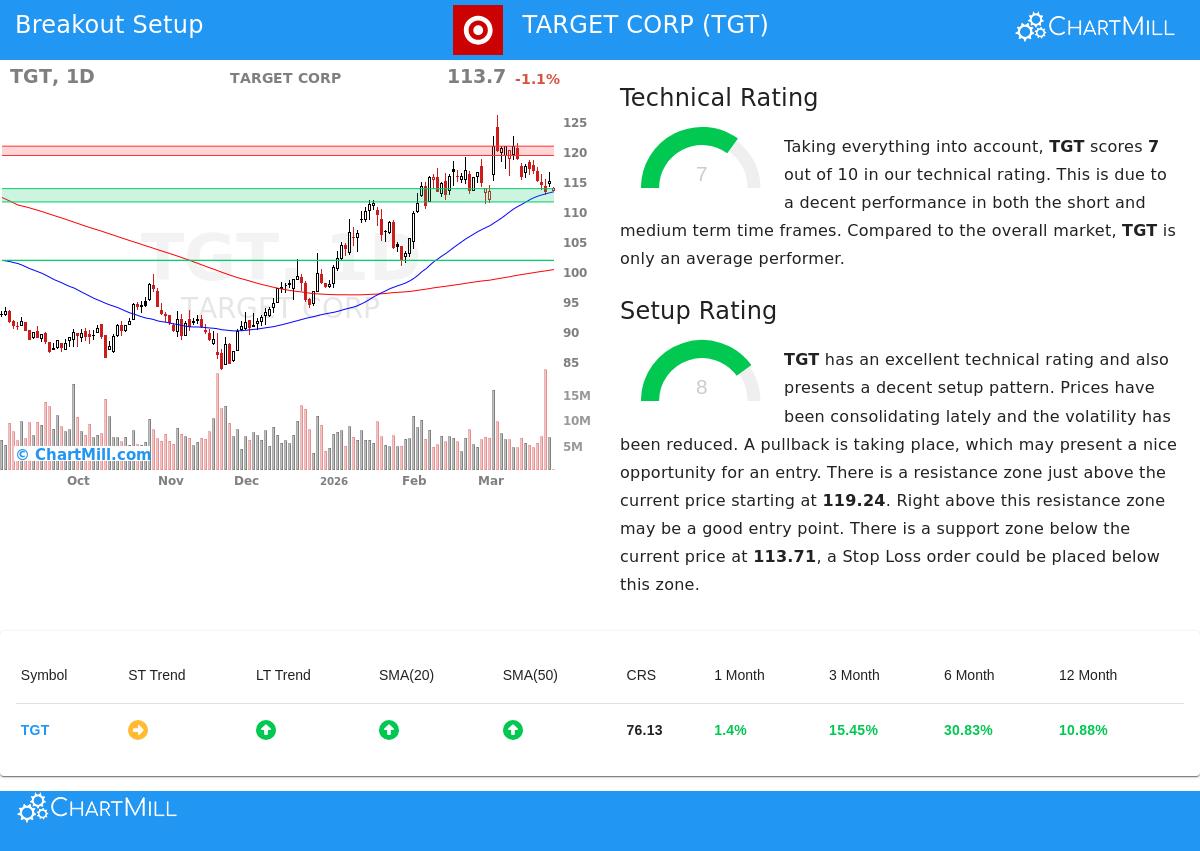
Examining the Technical Base
The first part of this method is verifying the stock's technical condition. ChartMill gives TGT a Technical Rating of 7 out of 10, which places it in an uptrend. This rating is calculated carefully; it brings together several time periods and measures to assess the stock's momentum compared to its own past and the wider market.
A look at the detailed technical report shows the foundation for this score:
- Trend Position: The long-term trend is seen as positive, while the short-term trend is neutral. This is a typical and often acceptable state where a stock rests inside a longer-term rising path.
- Moving Average Backing: The stock is priced above all its main simple moving averages (20, 50, 100, and 200-day), and each of these averages is also increasing. This ordered arrangement of support levels is a standard indicator of a positive trend formation.
- Relative Performance: Over the last year, TGT has done better than 76% of all stocks. Significantly, its price is trading in the higher section of its 52-week range, which matches the S&P 500 doing the same, showing it is maintaining position with the market's leading stocks.
This firm technical background is important because it raises the chance that any breakout from a resting formation will keep going in the direction of the existing trend, upward.
Reviewing the Setup Quality
A positive trend by itself is not a buy signal; entering after a steep rise involves risk. This is where the Setup Quality score becomes key. It finds times of rest or "narrow" price movement, which can accumulate force for the next move. TGT receives a Setup Rating of 8, indicating a good-quality formation is present.
The technical report points out the features that add to this positive setup score:
- Resting Phase Happening: The report states that "prices have been resting recently and the price movement has been less volatile." This is visible in the stock's trading band over the last month ($111.11 - $126.00), with the present price close to the lower part of that band, hinting at a retreat to possible support.
- Clear Support and Resistance: The examination notes specific technical levels. An important support area exists between $111.49 and $113.26, created by a combination of moving averages and trendlines. Directly above, resistance is seen at a trendline near $113.71, with a more important resistance area above that beginning at $119.24.
- A Possible Trade Plan: From this formation, the report describes a sample setup. An entry might be thought about on a breakout above the nearby moving averages around $116.42, with a stop loss set below the support area near $112.68. This establishes a specific, contained risk limit, which is a key part of a structured technical trade.
The high setup score affirms that TGT is not overstretched; rather, it is in a stage where the price movement has become narrow, providing a recognizable zone for risk control.
A Technical View for TGT
For investors using a breakout approach, TGT offers a notable situation. The stock has shown solid relative performance and is located within a long-term uptrend, as shown by its Technical Rating. At the same time, its high Setup Rating shows this momentum has stopped, forming into a resting pattern with clear limits.
The near-term technical contest is around the $113.71 resistance level. A continued move above this, and especially a break above the next area near $119, could indicate the restart of the uptrend. On the other hand, the grouped support between $111.49 and $113.26 gives a reasonable zone where buyers may act to protect the trend.
Interested in finding more possible breakout formations? Our daily Technical Breakout Setups screen regularly sorts the market for stocks showing this mix of technical soundness and good-quality setup formations.
Disclaimer: This article is for information only and is not investment advice, a suggestion, or an offer or request to buy or sell any securities. The examination uses technical information and should not be the only ground for an investment choice. All trading and investment choices include risk, including the chance of losing the original investment. Past results do not guarantee future outcomes. Always do your own investigation and think about your financial position and risk comfort before investing.