
In the world of investing, the search for undervalued stocks is a cornerstone of the value investing philosophy. This strategy, made famous by figures like Benjamin Graham and Warren Buffett, involves finding companies whose market price is below their estimated intrinsic value. The aim is to find good businesses that are temporarily out of favor or missed by the market, offering a possible "margin of safety" for investors. One organized way to conduct this search is to filter for stocks that show good fundamental health and earnings, yet are priced low using important valuation measures. This process helps select for companies that are not only low-priced, but are financially stable and able to expand, making them interesting picks for a value-focused portfolio.
A current filter using this thinking has found TE Connectivity PLC (NYSE:TEL) as a possible choice. The Swiss-American technology company, a worldwide leader in connectors and sensors, seems to offer a mix of good business fundamentals and a fair price, deserving more attention from investors looking for value.
Valuation: A Relative Bargain
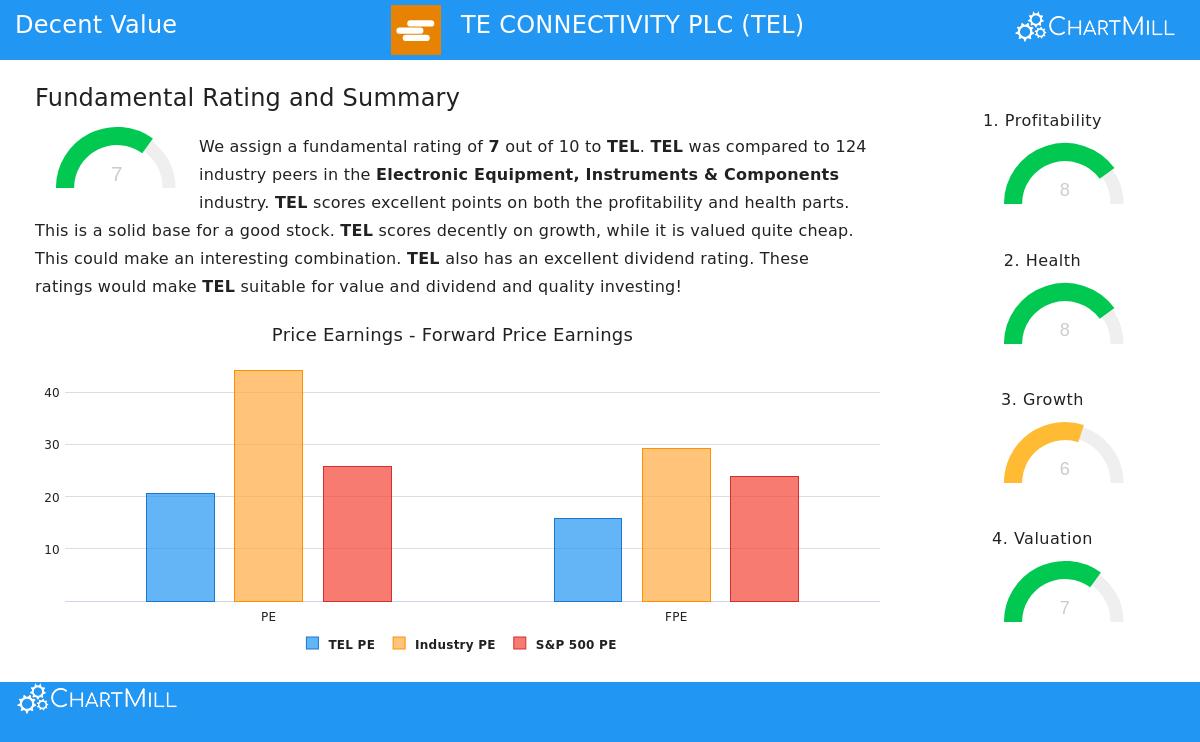
For a value investor, a good price is the main starting point. The filter looked for stocks with a strong ChartMill Valuation Rating, and TEL gets a 7 out of 10 here. A closer look at the fundamental analysis report shows the reasons.
While TEL's own Price-to-Earnings (P/E) ratio of 20.59 may not immediately suggest a low price, the comparison is important. The stock is priced lower than 78% of similar companies in the Electronic Equipment, Instruments & Components industry, which has an average P/E above 44. Also, its price compares well to the wider market, trading below the S&P 500's average P/E. More forward-looking measures add support:
- Its Price/Forward Earnings ratio of 15.71 is seen as somewhat lower than both the industry and S&P 500 averages.
- The Price/Free Cash Flow ratio shows TEL is priced lower than 82% of its industry rivals, an important measure for value investors who focus on real cash generation.
- A low PEG Ratio, which includes earnings expansion, indicates the current P/E is fair given the company's growth path.
This relative price view is key for the strategy because it finds a financially sound company trading at a lower price than its own sector and the market, not just a pure statistical outlier that could be a "value trap."
Financial Health: A Solid Foundation
A low-priced stock is only a good investment if the company is financially steady. This is how the margin of safety is created. TEL receives a good ChartMill Health Rating of 8, pointing to a strong balance sheet. Important points from the report are:
- Strong Solvency: An Altman-Z score of 4.88 indicates no short-term bankruptcy danger, and it is better than two-thirds of its industry on this measure.
- Manageable Debt: The company's Debt to Free Cash Flow ratio is a very good 1.82, meaning it could pay off all its debt with less than two years of cash flow. The report states that while the debt-to-equity ratio has declined year-over-year, the strong free cash flow gives sufficient coverage.
- Shareholder-Friendly Actions: The company has been lowering its share count over the past one and five years, a sign of careful capital use and a possible increase to earnings per share.
A good financial health score reduces one of the main risks in value investing: the possibility that a seemingly low-priced company is actually in financial trouble. TEL's strong solvency and cash flow traits provide that important buffer.
Profitability: Quality at a Reasonable Price
Value investing is not about buying weak companies at low prices; it is about buying good companies at a fair price. TEL's ChartMill Profitability Rating of 8 confirms it is a high-quality business. The company shows very good returns on capital, which is a sign of a lasting business.
- It has a Return on Invested Capital (ROIC) of 13.94%, better than 91% of its industry peers. This is above its cost of capital, confirming the company is building real shareholder value.
- Its Operating Margin of nearly 20% is one of the best in its sector, better than 96% of competitors. This high-margin operation gives strength during economic slowdowns.
- The company has been steadily profitable with positive cash flow for years.
This steady and high profitability is important for the value argument. It suggests the business has a competitive advantage and effective management, raising the chance that its intrinsic value will be seen by the market over time.
Growth: The Engine for Value Realization
Finally, for the low price gap to shrink, the company needs a growth catalyst. TEL's ChartMill Growth Rating is a good 6, showing it is not a static company. The report indicates a healthy growth picture:
- Strong Recent Performance: Earnings Per Share increased by a notable 24.25% over the past year, with Revenue up over 14%.
- Positive Outlook: Analysts expect this progress to continue, with predictions for average yearly EPS growth of 13.6% and Revenue growth of 8.8% in the coming years.
This growth element is what separates a possible value opportunity from a value trap. It provides a way for the market to price the stock higher as earnings rise, helping to achieve the upside suggested by the current price discount.
Conclusion
TE Connectivity PLC presents a case example in the modern value filter: a company with sector-leading profitability, a very strong financial base, and a clear growth path, all available at a price that is good relative to its peers and the wider market. It represents the idea of seeking quality merchandise at a discount. For investors using a careful value strategy, TEL's mix of fundamental strength and fair price makes it a stock worth more investigation.
This review of TE Connectivity came from an organized "Decent Value" filter. If you want to find other stocks that match this profile of fair valuation, health, profitability, and growth, you can see the full filter results here.
,
Disclaimer: This article is for informational purposes only and does not constitute financial advice, a recommendation, or an offer to buy or sell any securities. The analysis is based on data and ratings provided by ChartMill, and investors should conduct their own independent research and consult with a qualified financial advisor before making any investment decisions. Past performance is not indicative of future results.