
For investors who use charts and price action to guide their choices, the process often comes to two basic questions: which stock to purchase, and when to purchase it. A methodical way to answer these questions involves looking for stocks that show good technical condition and are making a constructive price pattern. The aim is to find leading stocks that are not only rising but also pausing their advance, giving a possible point to enter for the next rise. This method joins a stock's general technical condition with a review of its present trading pattern to find likely breakout chances.
TORONTO-DOMINION BANK (NYSE:TD) recently appeared from such a search, presenting a noteworthy case for technical investors. The Canadian banking giant, which works in personal, commercial, wealth, and wholesale banking areas, is now showing traits that match a standard breakout formation.
Technical Condition: A Base of Momentum
The first part of this plan is finding stocks with good underlying technicals. A high technical score implies a stock is in a confirmed uptrend across various time periods and is performing better than the wider market. For TD Bank, the technical view is very good.
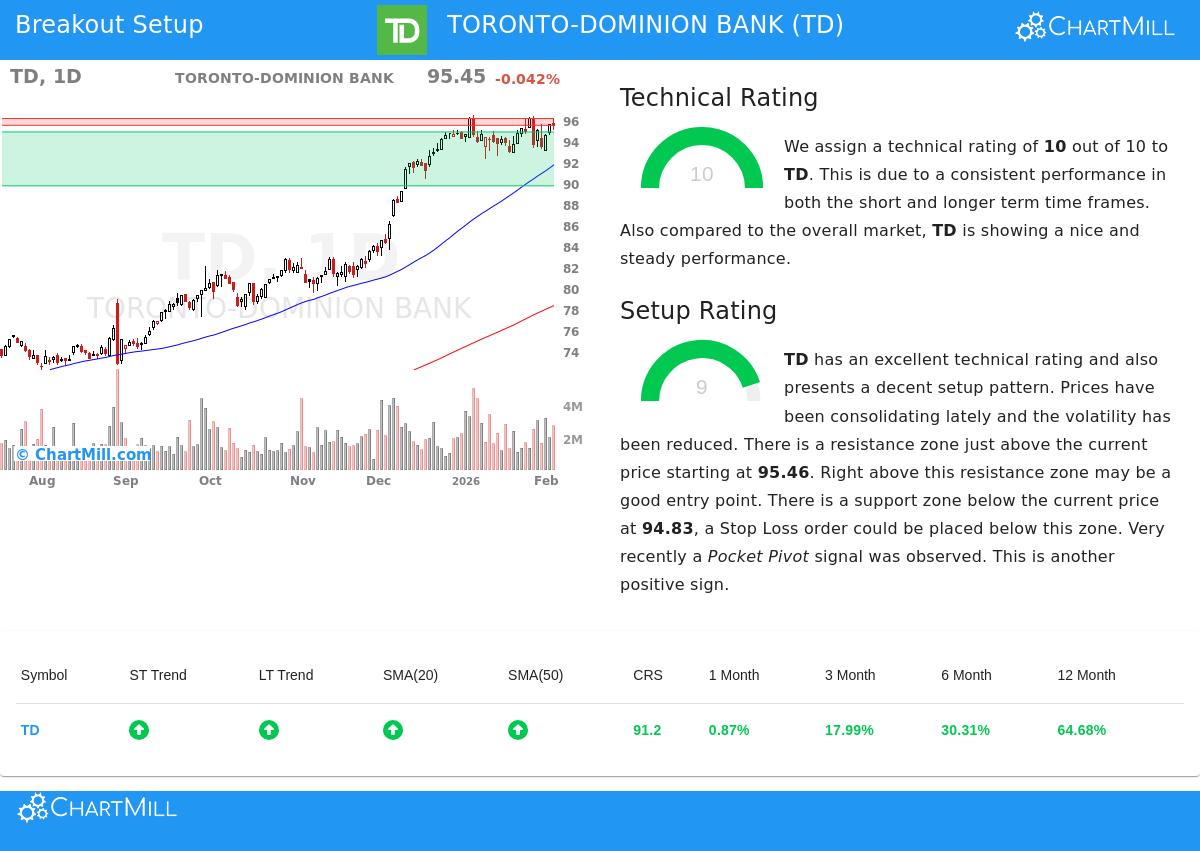
- Top Technical Score: TD gets a highest score of 10 on the ChartMill Technical Rating scale. This shows very good technical condition aimed at longer-term formations.
- Steady Uptrends: Both the near-term and longer-term trends for TD are rated as up, a pairing that shows aligned momentum.
- Market and Group Leadership: The stock is doing better than 91% of all stocks in the market over the last year and is in the top 7% of its banking industry group, which has 383 other stocks.
- Price Above Important Averages: TD is trading well above its important moving averages (20, 50, 100, and 200-day SMAs), all of which are rising. This stacked order of averages is a standard sign of continued positive momentum.
This base condition is important because it raises the chance that any following breakout from a pause pattern will keep going in the direction of the main trend. You can see the full technical review in the ChartMill Technical Report for TD.
Formation Quality: The Pattern for a Possible Breakout
A technically good stock is only part of the matter. The second question, when to buy, is answered by the formation quality. A high formation score looks for times of lower volatility and price pause, which often come before a notable directional move. This makes a clear risk zone for investors.
TD Bank now shows a high-quality formation, scoring a 9 out of 10. The study notes several constructive points:
- Narrow Pause: Over the last month, TD has traded in a small range between $92.22 and $96.38, letting moving averages move closer and gathering energy for a possible move.
- Clear Support and Resistance: The technical report finds a well-marked support area between $89.71 and $94.83, made by several trendlines and moving averages. Just above the present price sits a resistance area from $95.46 to $96.11.
- Lower Volatility & Positive Sign: The formation notes "lower volatility while prices have been pausing." Also, a recent "Pocket Pivot" sign, a price increase on higher-than-normal volume, was seen, often viewed as a mark of institutional buying.
This pairing is what technical investors look for: a strong stock pausing in an orderly way, with clear lines to mark both an entry trigger and a protective stop-loss.
A Clear Technical Situation
From this study, a specific, though not real, trading situation appears. The pause has made a resistance top near $96.11. A clear move above this line could signal the restart of the uptrend.
- Possible Entry: A break above the resistance, specifically above $96.12, could be used as a buy signal.
- Clear Risk: The nearby support area gives a logical place to set a stop-loss order, for example, below $93.10. This would cap the notional worst loss on the trade to about 3.1%.
- The Wider View: It is important to see this possible formation within TD's notable longer-term performance, which includes a 64.7% gain over the past twelve months. The present pattern may show a stop within a much larger positive trend.
Finding Like Chances
TD Bank shows the kind of chance technical breakout searches are made to find: a market-leading stock gathering energy for its next possible rise. For investors wanting to use this method to find other choices, new formations are found each day.
You can find more possible technical breakout formations by visiting the Technical Breakout Setups screen.
,
Disclaimer: This article is for information only and is not investment advice, a suggestion, or an offer to buy or sell any security. The trading situation described is made automatically and is an example. Always do your own research, think about your risk comfort, and know about coming company events like earnings reports before making any investment choices. Past performance does not show future results.