
AT&T INC (NYSE:T) has been identified as a Technical Breakout Setup Pattern by our stock screener. This pattern typically occurs when a stock takes a pause after a significant rise, indicating the possibility of a continuation in the trend. While it's impossible to predict with certainty, it might be beneficial to monitor NYSE:T.
Technical analysis of T
Every day, ChartMill assigns a Technical Rating to each stock, providing a score ranging from 0 to 10. This rating is determined by evaluating various technical indicators and properties.
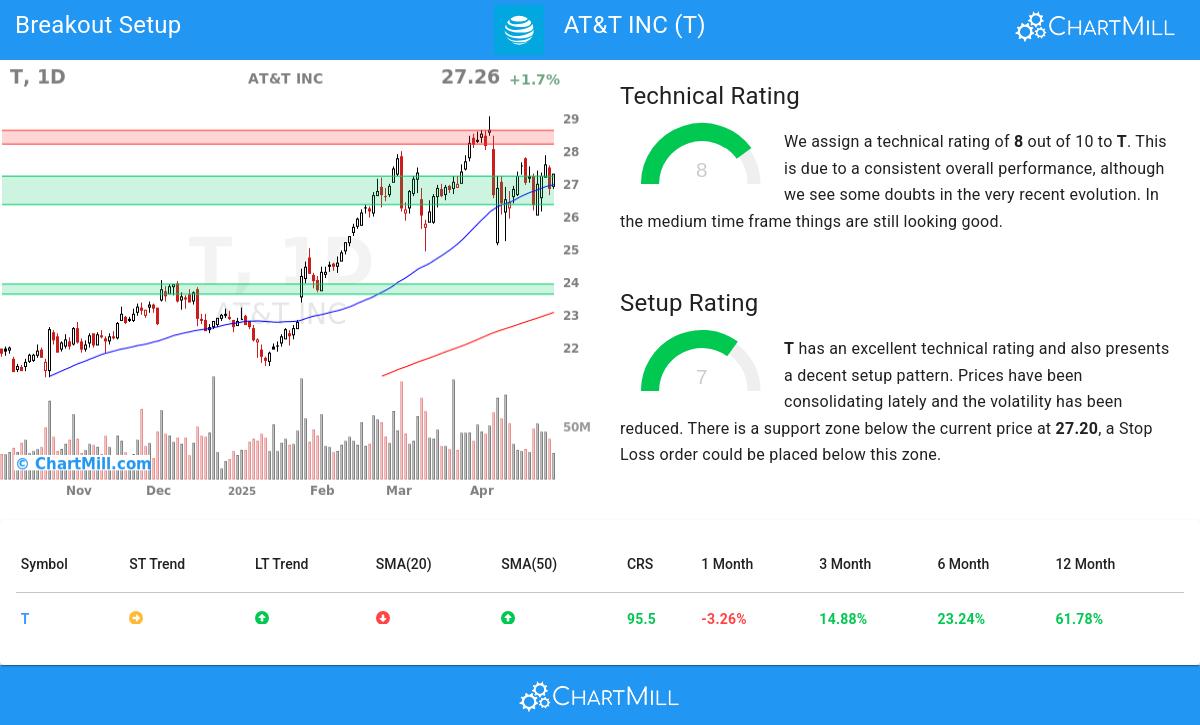
Taking everything into account, T scores 8 out of 10 in our technical rating. In the last year, T was one of the better performers, but we do observe some doubts in the very recent evolution.
- The long term trend is positive and the short term trend is neutral. The long term trend may just continue or reversal may be around the corner!
- Looking at the yearly performance, T did better than 95% of all other stocks. On top of that, T also shows a nice and consistent pattern of rising prices.
- T is one of the better performing stocks in the Diversified Telecommunication Services industry, it outperforms 87% of 33 stocks in the same industry.
- T is currently trading in the upper part of its 52 week range. The market is still in the middle of its 52 week range, so T slightly outperforms the market at the moment.
- In the last month T has a been trading in the 25.10 - 29.03 range, which is quite wide. It is currently trading in the middle of this range where prices have been consolidating recently, this may present a good entry opportunity, but some resistance may be present above.
Check the latest full technical report of T for a complete technical analysis.
Why is T a setup?
Alongside the Technical Rating, ChartMill assigns a Setup Rating to evaluate the consolidation level of a stock. This rating, ranging from 0 to 10, is updated daily and considers various short-term technical indicators. The current setup rating for T is 7:
Besides having an excellent technical rating, T also presents a decent setup pattern. Prices have been consolidating lately and the volatility has been reduced. There is a support zone below the current price at 27.20, a Stop Loss order could be placed below this zone.
Trading setups like T
To potentially initiate a trade, it is common practice to wait for the stock to break out of the consolidation zone. This breakout signifies a potential upward movement, and traders may enter the stock at that point. Conversely, if the stock falls back below the consolidation zone, it may be sold at a loss.
This article should in no way be interpreted as trading advice. You should always make your own analysis and trade or not trade based on your own observations and style. The article is based purely on some technical observations.
Every day, new breakout setups can be found on ChartMill in our Breakout screener.
Disclaimer
Important Note: The content of this article is not intended as trading advice. It is essential to perform your own analysis and exercise caution when making trading decisions. The article presents observations created by automated analysis but does not guarantee any trading or investment outcomes. Always trade responsibly and make independent judgments.