
A possible breakout setup was detected on AT&T INC (NYSE:T) by our stockscreener. A breakout pattern is formed when a stock consolidates after a strong rise up. We note that this pattern is detected purely based on technical analysis and whether the breakout actually materializes remains to be seen. It could be interesting to keep an eye on NYSE:T.
Insights from Technical Analysis
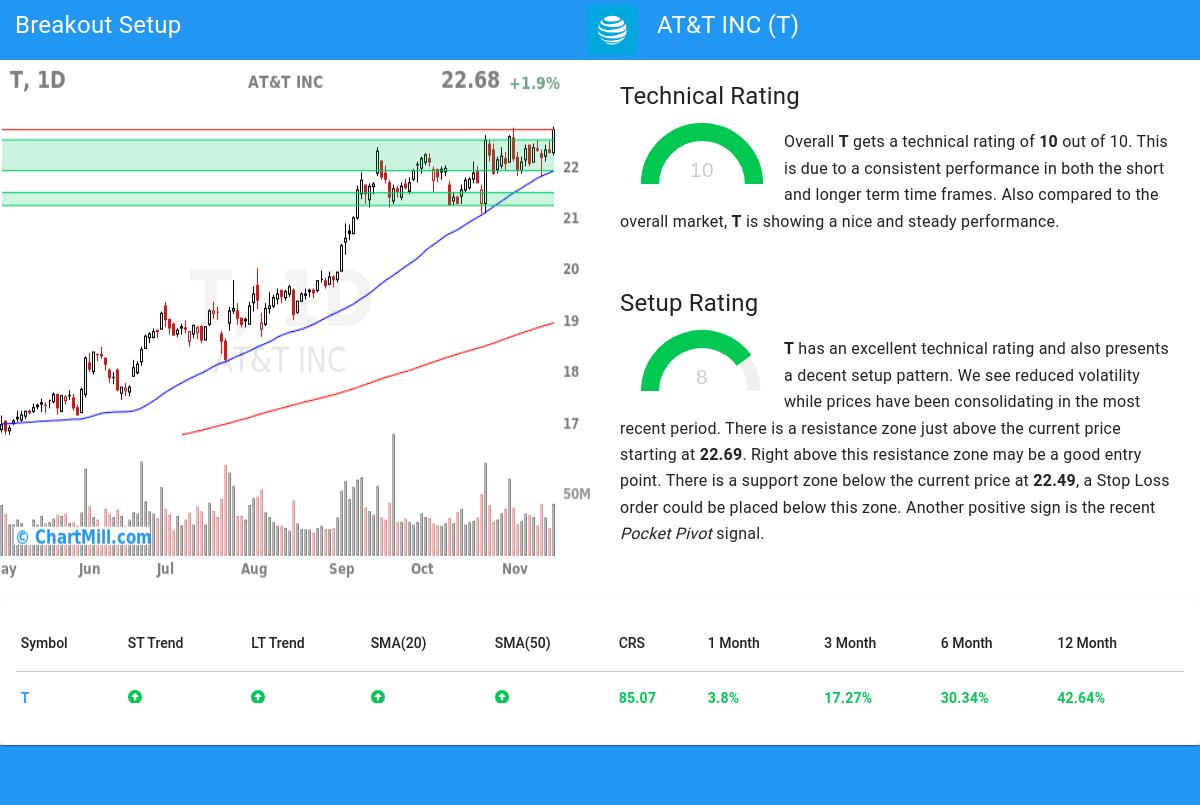
ChartMill assigns a Technical Rating to every stock. This score ranges from 0 to 10 and is updated daily. The score is determined by evaluating multiple technical indicators and properties.
Overall T gets a technical rating of 10 out of 10. Both in the recent history as in the last year, T has proven to be a steady performer, scoring decent points in every aspect analyzed.
- The long and short term trends are both positive. This is looking good!
- Looking at the yearly performance, T did better than 85% of all other stocks. We also observe that the gains produced by T over the past year are nicely spread over this period.
- T is one of the better performing stocks in the Diversified Telecommunication Services industry, it outperforms 78% of 33 stocks in the same industry.
- T is currently making a new 52 week high. This is a strong signal. The S&P500 Index however is also trading near new highs, which makes the performance in line with the market.
- In the last month T has a been trading in the 21.05 - 22.75 range, which is quite wide. It is currently trading near the high of this range.
Check the latest full technical report of T for a complete technical analysis.
How do we evaluate the setup for NYSE:T?
In addition to the Technical Rating, ChartMill provides a Setup Rating for each stock. This rating, ranging from 0 to 10, assesses the level of consolidation in the stock based on multiple short-term technical indicators. Currently, NYSE:T has a 8 as its setup rating, indicating its current consolidation status.
Besides having an excellent technical rating, T also presents a decent setup pattern. We see reduced volatility while prices have been consolidating in the most recent period. There is a resistance zone just above the current price starting at 22.69. Right above this resistance zone may be a good entry point. There is a support zone below the current price at 22.49, a Stop Loss order could be placed below this zone. Very recently a Pocket Pivot signal was observed. This is another positive sign.
How can NYSE:T be traded?
A breakout opportunity may arise when the stock surpasses the current consolidation zone and reaches new highs. Traders often wait for this breakout before considering buying the stock. To manage risk, a stop loss order could be placed below the consolidation zone to limit potential losses.
Disclaimer: This article is not intended to provide trading advice. It is crucial to conduct your own analysis and consider your own observations and trading style when making investment decisions. The article solely presents technical observations and should not be relied upon as a sole basis for trading.
Every day, new breakout setups can be found on ChartMill in our Breakout screener.
Disclaimer
This article should in no way be interpreted as advice. The article is based on the observed metrics at the time of writing, but you should always make your own analysis and trade or invest at your own responsibility.