
In the search for returns that exceed the market, many investors use systematic plans that join strict technical study with basic growth measures. One method, made famous by noted trader Mark Minervini, is made to find stocks in the first parts of strong upward moves, backed by quickening business foundations. This plan, often summarized in the "Trend Template," aims to purchase strength, not weakness, by concentrating on stocks that are already showing command. The plan is especially interesting to investors seeking fast growth who are ready to take on more movement for the chance of large returns, if the main company displays fast growth in sales and profits. A recent filter joining Minervini's Trend Template with a special High Growth Momentum (HGM) score has found one such possibility: Syndax Pharmaceuticals Inc (NASDAQ:SNDX).
Technical Base: Matching the Minervini Trend Template
The main part of Minervini's plan is a fixed group of technical rules called the Trend Template. Its goal is to sort for stocks in a clear Stage 2 upward move, making sure an investor is buying into confirmed motion instead of trying to find a low point. Syndax Pharmaceuticals now shows a clear match with these rules, which is a main reason it passed the first filter step.
A look at the important technical points shows a stock in a solid upward move:
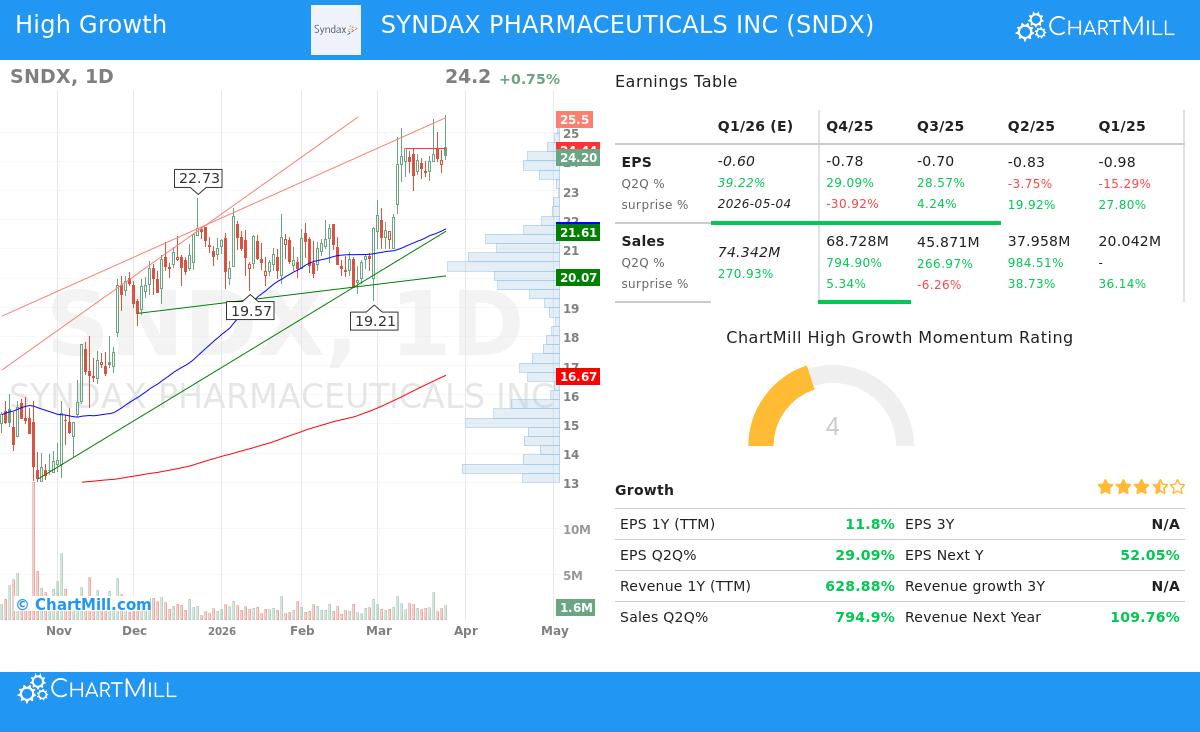
- Price vs. Moving Averages: The present price of $24.20 trades much higher than its rising 50-day ($21.69), 150-day ($18.69), and 200-day ($16.67) simple moving averages (SMAs). This meets the central template rule that price must be higher than all three key averages.
- Moving Average Order: The 50-day SMA is higher than the 150-day SMA, which is then higher than the 200-day SMA. This "layered" order of shorter-term averages above longer-term ones confirms a strong, steady upward move across several time views.
- Nearness to Highs: At $24.20, SNDX is trading within 5.4% of its 52-week high of $25.59, easily within the template's need to be within 25% of the high. At the same time, the stock is a large 182% above its 52-week low of $8.58, much more than the 30% limit. This shows great strength and a continued recovery move.
- Relative Strength Command: With a ChartMill Relative Strength (CRS) score of 91.4, SNDX is doing better than over 91% of the whole market. High relative strength is a required part of the Minervini idea, as it finds sector and market leaders, the stocks most probable to keep doing better.
This technical view is not only good, it is outstanding. The stock's "Technical Rating" from ChartMill's study is a full 10 out of 10, highlighting the soundness and length of its upward move. For a plan based on motion, this solid technical base is the needed first filter, removing weaker stocks and focusing money on the leaders.
Basic Driver: The Force for High Growth Motion
While a strong chart is needed, Minervini states that the largest gainers are always driven by basic betterment. This is where the "High Growth Momentum" part of the filter works. The HGM score judges a company's growth path and motion in key money measures. For a clinical-stage biopharmaceutical company like Syndax, usual profit measures are less important than fast sales growth, pipeline events, and analyst feeling.
The given data shows a company at a basic turning point:
- Fast Sales Growth: The most notable number is the Trailing Twelve Month (TTM) sales growth of 628.9%. More lately, last quarter's sales jumped 794.9% year-over-year. This type of very fast growth is a usual sign of companies moving from the development stage to selling, often starting a big re-pricing by the market.
- Earnings Motion: Although the company is not yet making money on a net basis (EPS TTM is -$3.29), the direction of change is positive. The EPS growth for the TTM time is 11.8%, and the last quarter showed a 29.1% gain compared to the same quarter a year before. Also, analysts are becoming more hopeful, increasing their earnings guesses for the next year by 8.77% over the last three months.
- Estimate Beats Creating Trust: The company has beaten earnings guesses in 3 of the last 4 quarters, with an average beat of 5.26%, and has topped sales guesses 3 times with an average beat of 18.48%. Steady better performance versus guesses builds trust with investors and can be a strong force for more price gains.
This basic picture matches the "Event" part of Minervini's SEPA (Specific Entry Point Analysis) method. The huge sales growth likely comes from the progress of its pipeline candidates, Revuforj and Niktimvo, and tells the market that the company's work is changing into real money results. For an investor seeking fast growth, this proof of a good product launch or deal is exactly the type of event looked for.
Present Position and Risk Points
According to ChartMill's full technical report, SNDX shows a clear position for study. The report states the stock is now showing a bull flag shape, a short pause after a strong rise, which can come before the move continues. The "Setup Quality" rating is a 6, showing prices have been pausing lately, which can give a clearer area for setting risk.
The study finds a close support area between $23.16 and $23.50, made by a mix of trend lines and moving averages. A sensible stop-loss order could be set just below this area, giving a set, technical point to exit if the upward move fails. The main block to watch is in the $24.23 to $24.44 range; a clear move above this level could signal the next step higher.
You can see the full, detailed technical study for SNDX here: ChartMill Technical Report for SNDX.
A Possibility for the Growth-Focused Motion Investor
Syndax Pharmaceuticals shows a strong example of a stock that meets strict rules from both a technical and basic motion view. Technically, it satisfies the Minervini Trend Template, trading in a strong upward move with better relative strength. Basically, it shows the fast sales growth and positive estimate changes that investors seeking fast growth follow. This mix tries to catch stocks that are not just going up, but doing so for a basic reason that could support the move.
Want to find other stocks that match this mix of strong moves and high growth? The filter that found SNDX is made to sort for exactly this mix. You can look at the present results and method yourself here: High Growth Momentum + Trend Template Screen.
Disclaimer: This article is for information and learning only. It is not advice to buy or sell any security. The study is based on given data and special filter rules. All investing has risk, including the possible loss of money. Investors should do their own full research, think about their money situation and risk comfort, and talk with a skilled money advisor before making any investment choices.