
In the search for stocks with strong potential, many investors join careful chart study with attention to basic business growth. One well-known method that mixes these areas is the system made popular by Mark Minervini. His method, often called the SEPA (Specific Entry Point Analysis) system, tries to locate market leaders early in their rise by using a fixed group of chart checks, the Trend Template, to make sure a stock is in a solid upward move, and then adding business health checks to verify speeding company progress. This two-part method tries to catch stocks that are not only strong on charts but also supported by better company results, a pair that can point to large future price gains.
Silicon Laboratories Inc (NASDAQ:SLAB) stands out as a present choice that seems to fit this strict investment thinking. The company, a maker of mixed-signal integrated circuits important for the Internet of Things (IoT), has had its stock show traits that call for more study from investors focused on growth.
Fitting the Minervini Trend Template
The main part of Minervini's chart filtering is the Trend Template, a list made to sort for stocks in a clear and solid Stage 2 upward move. SLAB at this time meets the main points of this template, which is important for the system as it places money on securities where the main force is with them, not opposite.
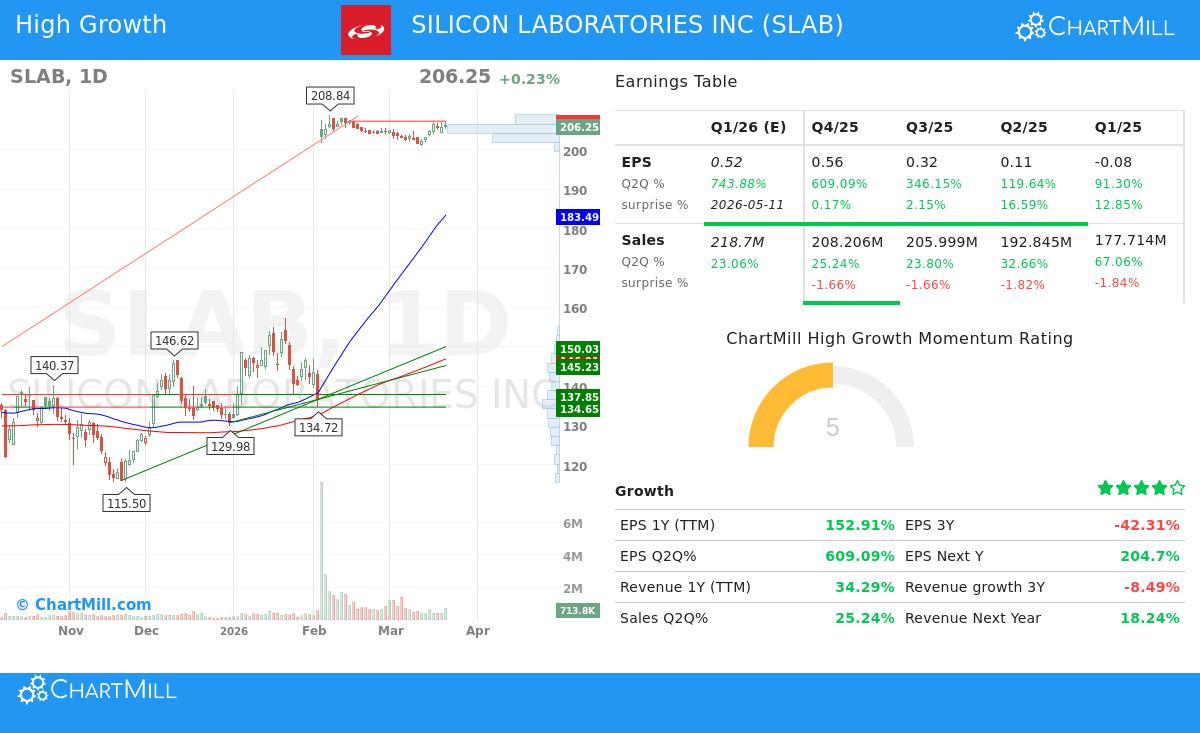
- Price Above Important Moving Averages: The stock trades notably above its 150-day ($149.78) and 200-day ($146.91) simple moving averages (SMAs). This position shows continued long-term buying and a good bull market stage for the shares.
- Upward Moving Average Directions: Both the 150-day and 200-day SMAs are moving up, supporting the force and length of the set upward move. Also, the nearer-term 50-day SMA ($183.49) is placed above both longer-term averages, a standard positive arrangement showing faster speed.
- Nearness to Highs: A main Minervini point is to concentrate on force, not looking for cheap prices. SLAB's price is within 1.2% of its 52-week high of $208.84 and sits about 149% above its 52-week low of $82.82. This shows solid comparative results and a habit to guide the market, not trail it.
- Better Comparative Force: With a ChartMill Relative Strength (CRS) score of 94.86, SLAB is doing better than almost 95% of all stocks in the market. High comparative force is a required filter in the Minervini system, as it finds the true leaders that large investor money is moving toward.
Meeting Standards as a Fast-Growth Choice
While the Trend Template makes sure a stock is chart-wise correct, the "High Growth Momentum" (HGM) score tries to check that the basic business is working very well. For Minervini, fast profit and sales growth are often the business causes that push a chart-ready stock into a large gain. SLAB's recent money measures show this type of strong speed increase.
- Profit Growth Jump: The company has shown notable earnings per share (EPS) growth. Year-over-year EPS growth for the past twelve months is at 152.9%. More notably, the newest three-month EPS jumped over 609% compared to the same three months last year, with the earlier three-month periods also showing solid three-figure growth.
- Steady Profit Surprises: SLAB has topped analyst EPS guesses in each of the past four three-month periods, with an average beat of 7.94%. This series of positive surprises can push upward changes in future guesses, an event Minervini notes as a main force for stock results.
- Sales Speed Increase Again: After a time of slowing, sales growth has turned clearly positive. The latest three-month sales grew by 25.2% year-over-year, adding to positive growth in earlier three-month periods. This top-line speed increase again gives a firm base for the bottom-line jump.
- Good Free Cash Flow Creation: The company's free cash flow per share has grown by over 356% in the past year, showing that its profit growth is turning into high-quality, real cash creation, a key sign of money health for a growth company.
Chart Condition and Position
Beyond the basic Trend Template filters, a deeper chart study of SLAB shows a stock in very good condition. According to ChartMill's own evaluation, the stock gets a perfect Chart Rating of 10/10, showing better results across short and long-term periods. The stock is also showing a good position, with a Position Quality rating of 8/10. The study notes the stock has been moving in a small area near its highs, making what might be seen as a bull flag shape, a possible continuation position. A recent "Pocket Pivot" signal, which shows buying by large investors, adds more positive detail. For a full look at the support, resistance points, and a sample trade position, you can see the complete chart report for SLAB.
End
Silicon Laboratories Inc gives a strong example of a stock that at this time fits a strict growth and speed system. It meets the firm chart needs of the Minervini Trend Template, confirming it is in a solid, leading-position upward move. At the same time, its business picture shows the type of fast-growth speed, marked by fast profit growth, steady beats, and sales speed increase again, that can give the cause for more price gains. While the wider market's long-term direction stays a factor, SLAB's own force is noteworthy.
Want to find other similar possible choices? You can use the same "High Growth Momentum + Trend Template" filter that found SLAB to see other stocks that meet these joined standards. Study the filter here: High Growth Momentum & Trend Template Screen.
Note: This writing is for information and learning only. It is not meant as investment guidance, a suggestion, or a plan to buy or sell any security. The study is based on present facts and methods, which may change. Buying stocks includes risk, including the possible loss of the first amount. Always do your own study and think about talking with a skilled money advisor before making any investment choices.