
The method used to find possible investment candidates joins a strict technical structure with attention to fundamental growth speed. This method is drawn from the tactics of famous trader Mark Minervini, who stresses the need to buy stocks that are already in solid upward moves and are supported by quickening business results. The main technical screen is the Minervini Trend Template, a list made to confirm a stock is in a verified, strong Stage 2 rise. This is combined with a filter for a high Growth Momentum score, which looks for firms showing outstanding and frequently quickening growth in profits and sales. The aim is to locate securities where better price movement is confirmed by better basic business directions, possibly giving a good risk/reward setup for investors focused on growth.
Solaris Energy Infrastructure (NYSE:SEI) appears as a stock that now meets this joined standard, offering a case study in matching solid technicals with strong fundamental speed.
Meeting the Minervini Trend Template
A key part of the Minervini tactic is to trade in the direction of the main trend, steering clear of the problems of trying to buy a declining stock. The Trend Template gives an organized way to spot stocks in sound, long-term upward trends. SEI's present chart shows a clear match with these technical needs:
- Price Above Key Moving Averages: The stock trades well above its rising 50-day, 150-day, and 200-day simple moving averages (SMAs). This ordered placement signals continued buying interest across all main time periods.
- Positive Moving Average Slope and Alignment: Importantly, the 200-day SMA is not just a price but is moving upward, verifying a long-term positive phase. Also, the 50-day SMA is above the 150-day SMA, which is above the 200-day SMA, a standard sign of a strong, steady upward trend.
- Proximity to Highs: SEI's price is about 333% above its 52-week low and within 12% of its 52-week high. Minervini’s thinking prefers stocks displaying strength by trading close to their highs, as they are frequently market front-runners, not stragglers stuck in sideways patterns.
- Superior Relative Strength: With a ChartMill Relative Strength (CRS) score of 97.65, SEI is doing better than nearly 98% of all stocks in the market. High relative strength is a required part of the tactic, finding securities that are wanted independent of wider market moves.
This combination of elements indicates SEI is in a definite Stage 2 rise, the exact setting where Minervini aims to place money.
Qualifying for High Growth Momentum
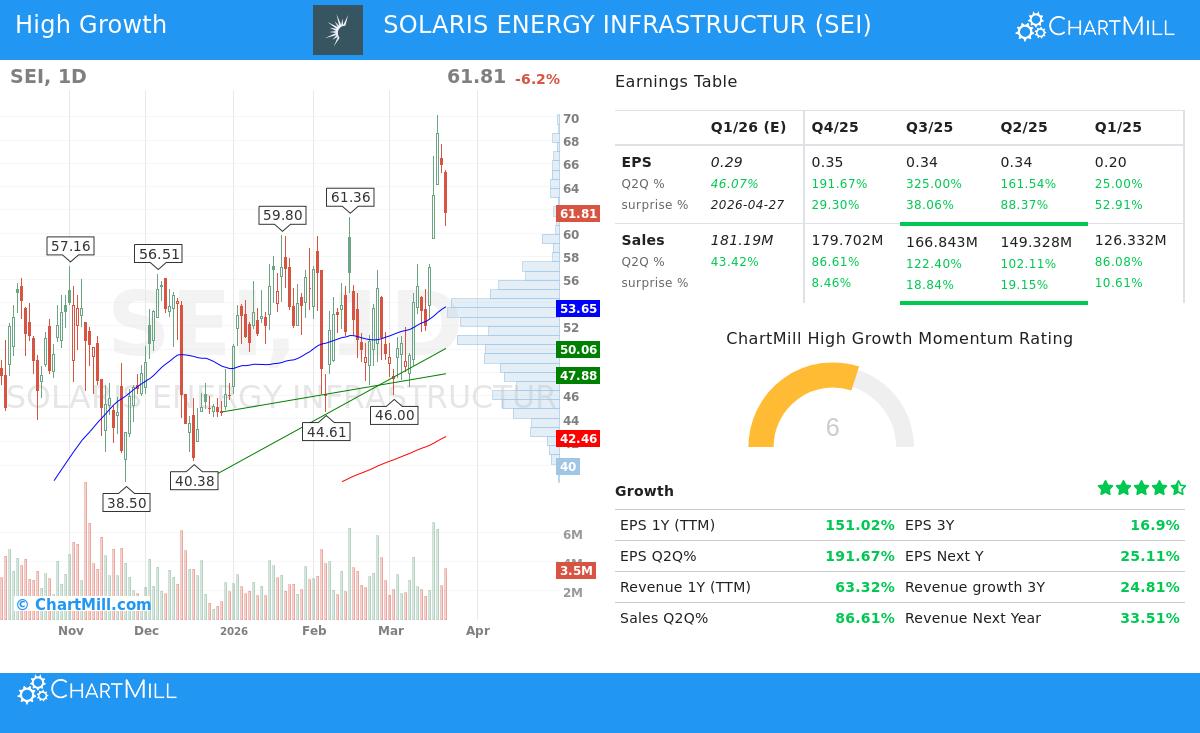
While solid charts can occasionally be made on speculation, the Minervini method looks for the confirmation of fundamental quickening. The "High Growth Momentum" filter searches for firms where profit and sales growth is not only good, but outstanding and often getting better. SEI’s recent financial numbers show this kind of forceful operational performance:
- Forceful Earnings Growth: The company’s earnings per share (EPS) growth on a trailing twelve-month (TTM) basis is a notable 151%. More significantly, the sequential three-month speed is striking, with the newest quarter showing year-over-year EPS growth of 192%, after a 325% jump in the quarter before. This sequence of quickening is a main feature looked for by growth investors.
- Strong Sales Increase: This profit jump is backed by formidable income growth. TTM income has risen over 63%, with the last quarter showing an 87% year-over-year gain. The company has also regularly beaten income forecasts, surpassing expectations in each of the last four quarters.
- Getting Better Profitability: Beyond sales growth, the company's profit margin in the newest quarter (8.38%) shows a clear gain over the margins reported in the two previous quarters. This shows that growth is turning more effectively into net profit, a signal of operational efficiency and pricing ability.
For a growth investor, this mix of quickening profits supported by solid sales growth and widening margins forms a strong fundamental driver that can support and maintain a climbing stock price.
Technical Health and Current Setup
Based on ChartMill’s own analysis, SEI receives a perfect Technical Rating of 10 out of 10, showing sound health across both short and long-term periods. The report states the stock is doing better than 97% of the market and 93% of its Energy Equipment & Services industry group, confirming its front-runner position. The long-term and short-term directions are both seen as positive.
Still, the analysis also gives an important note of care for entry timing. The stock’s Setup Quality rating is now low (3 out of 10). This means that after a strong climb, the stock is up over 25% in the past month, it is trading near the peak of its recent range and could be stretched in the near term. The report proposes that while the technical base is very good, the stock does not currently present a perfect, low-risk entry chance and could gain from a time of settling or decline. Investors focused on the long-term idea might watch the stock for a more favorable setup to form. A complete look at the technical view, including support points and volume study, is found in the detailed technical report for SEI.
Conclusion
Solaris Energy Infrastructure offers a strong case where a solid technical direction, as described by the Minervini Trend Template, is being driven by confirmed, high-speed fundamental growth. The stock’s front-runner position, verified by its better relative strength and forceful profit quickening, matches the idea of investing in market front-runners during their growth period. While the present forceful move suggests watching for a more balanced entry, SEI shows the kind of security that growth and speed screens are built to find.
For investors looking for more candidates that fit this mix of strict technical and fundamental standards, the "High Growth Momentum + Trend Template" screen can be a useful beginning point for more study.
Disclaimer: This article is for information and learning only. It is not meant as investment guidance, a suggestion, or a plan to buy or sell any security. The analysis uses data and methods thought to be dependable, but no promise is made about its correctness or fullness. Investing in stocks includes risk, including the possible loss of original money. You should do your own study and talk with a skilled financial consultant before making any investment choices.