
In the effort to spot stocks with high potential, many investors combine strict technical study with fundamental growth filters. One well-known method is the strategy made popular by Mark Minervini, which focuses on locating stocks in strong uptrends—what he calls Stage 2—while also requiring solid underlying business momentum. This technique is not about locating inexpensive stocks, but about locating the correct stocks at the correct time: those showing better price strength, backed by speeding up earnings and sales growth. A practical use of this thinking is to filter for securities that first pass the exact technical requirements of the Minervini Trend Template, confirming a sound chart formation, and then add filters for high growth momentum to verify fundamental strength. This two-part method seeks to separate companies that are not only ahead of the market on price but are also supported by gaining financial results.
A Candidate in View: Rallybio Corp (NASDAQ:RLYB)
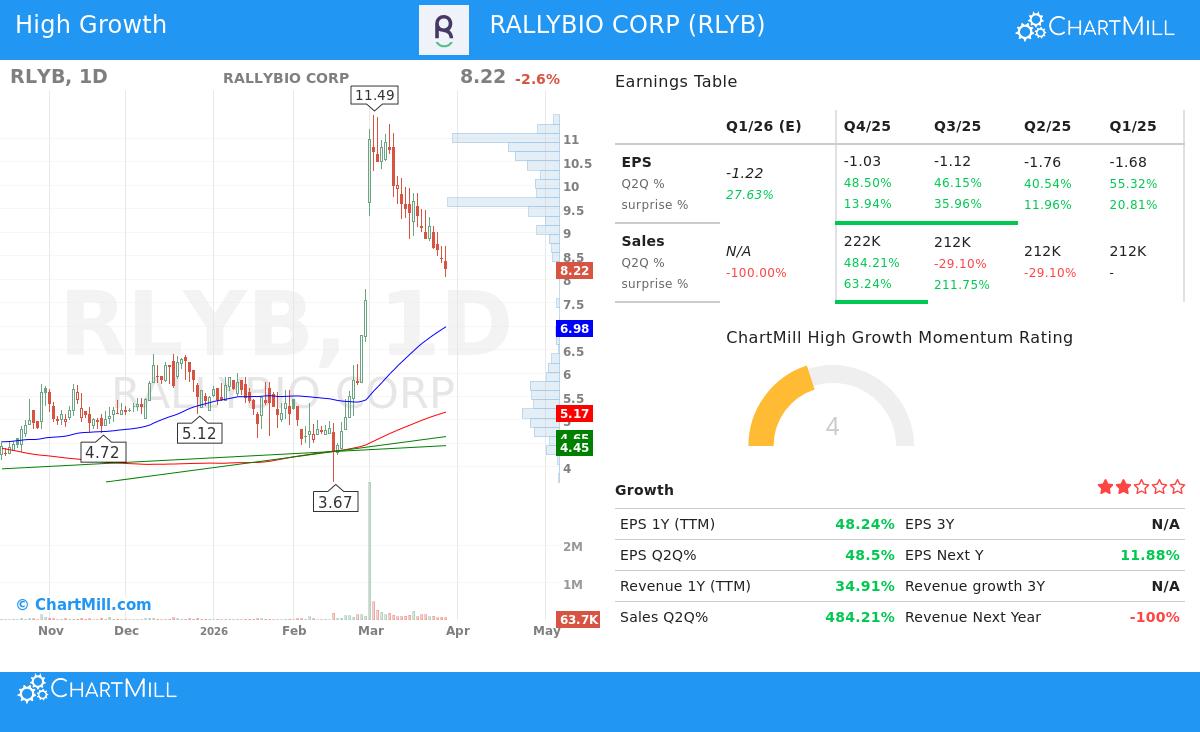
Rallybio Corp (NASDAQ:RLYB) is a clinical-stage biotechnology company centered on creating treatments for severe and rare diseases. Its development portfolio includes candidates aimed at complement dysregulation and hematology, with its lead program, RLYB116, being created as a convenient, subcutaneously injected C5 inhibitor. As a pre-revenue biotech, its investment story is naturally linked to clinical advancement and pipeline possibility, making the match of its stock chart with high-growth models a significant point of study.
Technical Match with the Minervini Trend Template
The Minervini Trend Template gives a step-by-step list to verify a stock is in a verified, lasting uptrend. Based on the given data, RLYB seems to meet the main technical requirements:
- Price Above Key Moving Averages: The present price of $8.22 trades well above the rising 50-day ($6.98), 150-day ($5.70), and 200-day ($5.17) simple moving averages (SMAs). This order is a basic part of the Trend Template, showing both short-term and long-term positive momentum.
- Moving Average Order: The 50-day SMA is positioned above both the 150-day and 200-day SMAs, and the 150-day SMA is above the 200-day SMA. This arranged, rising sequence of averages is a standard sign of a solid Stage 2 rise and a main filter in Minervini's filtering process.
- Nearness to Highs: While the stock is presently trading closer to the bottom of its recent one-month range, its place compared to the 52-week period is positive for the template. The present price is about 367% above its 52-week low of $1.76, easily meeting the "at least 30% above" rule. It is also within 25% of its 52-week high of $11.49.
- Better Relative Strength: A central part of the Minervini strategy is to invest in market leaders. RLYB's ChartMill Relative Strength (CRS) score of 93.51 shows it is doing better than over 93% of all stocks in the market over the past year. This outstanding relative strength is a vital requirement, as Minervini regularly looks for stocks with RS rankings above 70, and ideally in the 80s or 90s.
Meeting these technical requirements implies RLYB has shown the type of strong, leading price movement that Minervini's approach aims to catch early in a major rise.
Fundamental Filtering for High Growth Momentum
For a growth-centered strategy, a sound chart must be backed by gaining fundamentals. The given data indicates notable momentum in RLYB's financial measures, which is exactly what growth filters try to locate. The "High Growth Momentum (HGM)" rating includes elements like earnings speed-up and estimate changes.
- Earnings Growth Speed-Up: A notable part is the step-by-step gain in year-over-year EPS growth rates over recent quarters. The data shows growth of 40.54% two quarters ago, speeding up to 46.15%, and then to 48.50% in the most recent quarter. This sequence of speed-up is a strong sign in growth investing, often coming before major price re-ratings as it shows gaining business path.
- Steady Earnings Surprises: The company has surpassed EPS estimates in each of the last four quarters, with an average beat of 20.67%. This record of beating expectations builds trust with investors and can be a reason for more institutional interest.
- Sound Longer-Term Growth: On a yearly basis, EPS growth for the last reported full year was 48.24%, a large rise from the 26.63% growth reported the year before. This shows a continued and speeding growth pattern on a wider timeframe.
While common valuation measures are less applicable for a clinical-stage biotech, the large sales growth in the last quarter (484.21%) and solid free cash flow growth (39.51% year-over-year) further point out operational momentum. It is significant to note that analyst estimates for future periods show large revision, which is common for companies at this development stage and shows the high-risk, high-reward character of the field.
Technical Condition Summary
The separate technical study report for RLYB gives a detailed view. It gives the stock a high technical rating of 9 out of 10, reflecting its solid long-term positive trend and market-leading relative strength. The report notes that RLYB does better than 80% of its biotechnology industry peers. However, it also states that the stock has seen strong recent price movement and is trading near the bottom of its recent range, leading to a more average setup quality score. This implies that while the long-term trend is good, investors following Minervini's rules of exact entry points might wait for a more steady consolidation pattern before thinking about a new position. A full breakdown of the technical view, including support levels and trend study, can be seen in the full ChartMill Technical Report for RLYB.
Locating Comparable Chances
Rallybio Corp shows a case study of a stock that passes two filters for trend and growth momentum. For investors curious in using this combined filtering method to find other possible candidates, the preset filter is ready for use. You can study the present market for similar patterns by using the High Growth Momentum + Trend Template filter on ChartMill.
Disclaimer: This article is for information and learning only. It does not form investment guidance, a suggestion, or an offer to buy or sell any security. The study is based on given data and shows conditions at a specific moment. Investing in securities, especially in clinical-stage biotechnology companies, includes large risk, including the possible loss of principal. You should do your own study and talk with a qualified financial advisor before making any investment choices.