
For investors who use technical analysis to find possible opportunities, a common method looks for stocks that are both technically sound and ready to rise. This method aims to mix momentum with timing, concentrating on securities that are already in clear uptrends but are now pausing, pointing to a possible next move upward. One way to find these patterns is by searching for stocks with high proprietary scores for both technical condition and pattern quality, as set by ChartMill. A recent search using this system has pointed to RAPT THERAPEUTICS INC (NASDAQ:RAPT) as a candidate that deserves more attention from a technical viewpoint.
Technical Condition: The Base for Momentum
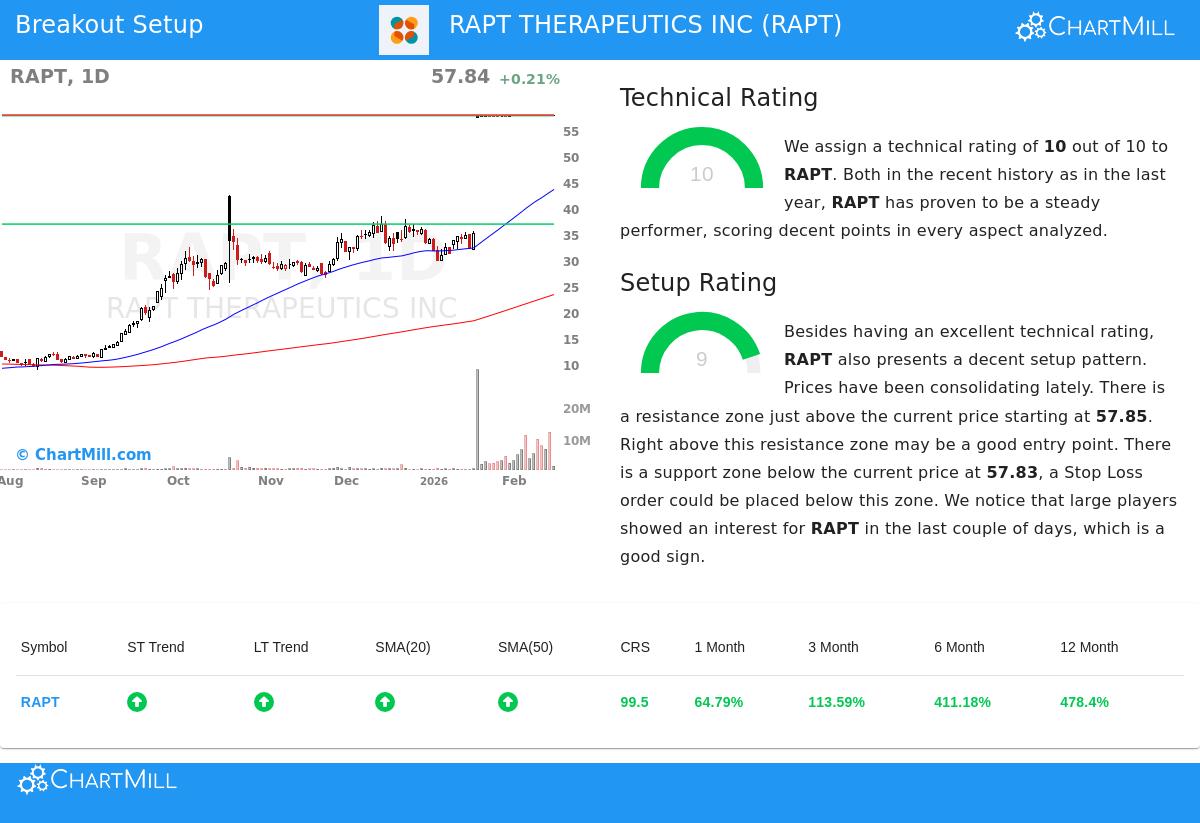
The first part of this breakout method is finding stocks with sound basic technical condition. This is important because it shows the stock is in a continuing uptrend and is a market frontrunner, not just having a temporary rise. RAPT's technical condition is very sound, receiving a complete ChartMill Technical Rating of 10 out of 10. A full look at this rating, found in the full technical report, shows several notable points:
- Trend Direction: Both the short-term and long-term trends for RAPT are scored as positive. This agreement across time periods is a strong sign of steady buying pressure and an absence of major selling.
- Market and Industry Performance: The stock is doing better than 99% of all stocks in the market over the last year and 98% of others in the Biotechnology field. This outstanding relative performance is a sign of field leaders.
- Moving Average Position: The stock's price is above all main moving averages (20, 50, 100, and 200-day SMAs), and each of these averages is itself in a rising pattern. This forms a stacked base under the present price.
- New Highs: RAPT is now trading at new 52-week highs, confirming the condition of its current uptrend.
This combination of positive signs indicates RAPT is not only a sound stock but is one of the soundest in the whole market from a pure price and trend viewpoint, giving a firm base for any possible breakout move.
Pattern Quality: Finding the Pause
While technical condition finds what to buy, pattern quality deals with when to buy. A high pattern score shows a stock is in a pause stage, trading in a narrow range after a previous gain. This tightening action often comes before a clear breakout. RAPT shows a high-quality pattern, with a ChartMill Pattern Rating of 9 out of 10.
The technical report states that RAPT has been trading in a narrow range over the last month, between about $57.46 and $57.86. This time of low movement and sideways action after a large rise is a standard pause pattern. For a breakout trader, this makes a clear and set level to watch:
- Resistance Area: A clear resistance area is found just above the present price, starting at $57.85. A continued move above this area could signal the end of the pause and the start of a new upward push.
- Support Area: A close support area exists around $57.83, giving a logical and narrow area to set a protective stop-loss order if the expected breakout does not happen.
- Large Trader Activity: The report also states more activity from big participants in recent days, which can be a sign before a large move.
This high pattern rating is key for the method because it indicates the stock is not "overstretched." Instead, it is stopping and gathering force, offering a possible entry point with a clearly set risk level just below support.
A Possible Trade Pattern
Based on this review, the technical report proposes a specific, automated trade pattern. It suggests an entry on a buy-stop order at $57.86, just above the noted resistance, with a stop-loss at $57.68, just below the nearby support. This would cap the theoretical risk on the trade to under 0.5%. It is very important to know this is an example created from the technical factors, any trade choice must be based on an investor's own review, risk comfort, and knowledge of company-specific facts, like its clinical-stage biopharmaceutical pipeline.
Finding More Possibilities
RAPT THERAPEUTICS INC shows the kind of possibility a technical breakout screen tries to find: a market-leading stock in a sound uptrend that is now pausing in a narrow range. For investors wanting to see other stocks that now meet similar high technical and pattern conditions, new candidates are found each day. You can see the current list of possible breakout patterns by going to the Technical Breakout Setups screen.
Disclaimer: This article is for information only and does not make up investment advice, a suggestion, or an offer to buy or sell any security. The review is based on technical data and automated scoring models. Investing has risk, including the possible loss of principal. Always do your own research and think about talking with a qualified financial advisor before making any investment choices.