
For investors using charts and price action to make decisions, a methodical way to find possible trades is important. One approach looks for stocks that are both technically sound and building a positive price pattern, a pairing that can point to a likely breakout chance. This method centers on two main proprietary measures: the ChartMill Technical Rating, which judges the general condition and direction of a stock, and the ChartMill Setup Quality Rating, which checks if the stock's present price action shows a clear and lower-risk entry point. By sorting for stocks with good scores in both areas, traders try to find leading stocks that are resting before their next possible move up.
A recent filter using this method has pointed to PHILIP MORRIS INTERNATIONAL (NYSE:PM) as a candidate deserving more attention from a technical view. The company, a worldwide leader in tobacco and smoke-free products such as its IQOS system, is displaying interesting chart traits that match the breakout filter conditions.
A Base of Technical Soundness
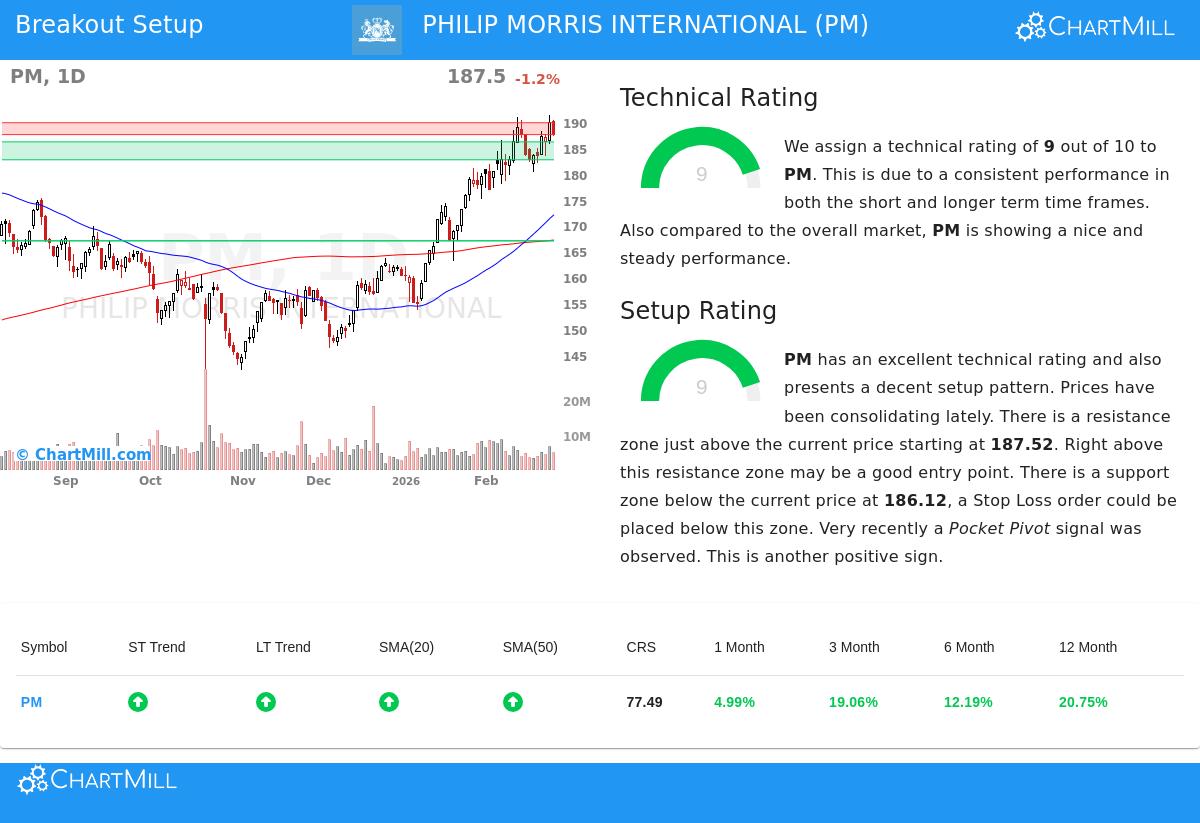
The first part of this method is finding stocks with good underlying technicals, as a solid trend gives the push required for a good breakout. PHILIP MORRIS INTERNATIONAL does well here, having a nearly perfect ChartMill Technical Rating of 9 out of 10. A close look at the full technical report shows the base for this high score:
- Trend Agreement: Both the near-term and longer-term trends for PM are marked as positive. This agreement across different periods is a strong sign of continued buying interest and lowers the chance of moves against the trend.
- Good Relative Performance: The stock's yearly performance puts it ahead of 77% of all other stocks in the market, showing it is a relative strength leader. It is also trading close to its 52-week high of $191.30, a mark of soundness, particularly as this performance matches the wider market's own highs.
- Supportive Moving Averages: The stock price is trading above all its main simple moving averages (20, 50, 100, and 200-day), and each of these averages is in a rising formation. This layered agreement of rising averages is a typical sign of a sound uptrend.
This very good technical rating answers the important question of which stock to review. It confirms PM is not in a disorganized or poor state but is a market leader showing a clear and solid upward trend, making it a fitting candidate for a trade expecting the trend to continue.
A Good Setup for Entry
A solid trend by itself is not a signal to buy; entering at a stretched price can lead to quick declines. The second part of the method is the Setup Quality Rating, which finds pause patterns that present a clear risk/reward entry. PM scores a 9 here too, meaning a good setup is present.
- Pause Within a Band: The technical report states that over the last month, PM has been trading in a band between about $175 and $191. It is now near the top of this band, having reduced any overbought state and formed a base of support.
- Clear Support and Resistance: The analysis finds a well-marked support area between $182.66 and $186.12, made by a mix of trendlines and moving averages. Just above the present price, a resistance area exists from $187.52 to $189.81. This creates a clear technical structure: a move above resistance could signal the next upward push, with the support area below giving a reasonable place to set a protective stop-loss order.
- Supportive Volume Activity: Very lately, the stock showed a "Pocket Pivot" signal, a pattern where the price rises on volume higher than the largest down-volume day in the recent period. This is often seen as quiet buying by large investors, adding a positive detail to the setup.
This high setup quality deals with the question of when to think about an entry. It indicates the stock is not running up but is instead tightening in a close pattern, offering a possible lower-risk entry point just above the marked resistance on a convincing move higher.
Combining the Trade Idea
For a technical trader, the combination of a Technical Rating of 9 and a Setup Rating of 9 makes PHILIP MORRIS INTERNATIONAL a notable filter result. The stock shows the preferred profile: a market-leading uptrend that has stopped to build a positive pause pattern near highs. The automated analysis proposes a possible trading situation where a move above the $189.82 resistance could act as a trigger, with a stop-loss set below the $186.12 support area to control risk. It is important to recall that this is an example created from the technical levels; investors must always do their own review, think about fundamental items like next earnings, and adjust position size and stops to their personal risk level.
This filter is used each day to find new possibilities as the market changes. You can see the present list of technical breakout setups by going to the Technical Breakout Setups screen.
Disclaimer: This article is for informational purposes only and does not constitute investment advice, a recommendation, or an offer or solicitation to buy or sell any securities. The analysis presented is based on technical metrics and automated reports. All investing involves risk, including the potential loss of principal. Past performance is not indicative of future results. Always conduct your own due diligence and consult with a qualified financial advisor before making any investment decisions.