
Growth investors are looking for stocks showing high revenue and EPS growth. We will have a look here to see if PROTALIX BIOTHERAPEUTICS INC (NYSEARCA:PLX) is suited for growth investing. Investors should of course do their own research, but we spotted PROTALIX BIOTHERAPEUTICS INC showing up in our Minervini growth screen, so it may be worth spending some more time on it.
Does PLX pass the Minervini Trend Template check?
The Minervini Trend Template is a set of technical criteria designed to identify stocks in strong uptrends. We can check all the boxes for PLX:
- ✔ Relative Strength is above 70.
- ✔ Current price is within 25% of it's 52-week high.
- ✔ Current price is at least 30% above it's 52-week low.
- ✔ The current price is above the 50-, 150- and 200-day SMA price line.
- ✔ The SMA(200) is trending upwards.
- ✔ The SMA(150) is above the SMA(200)
- ✔ The SMA(50) is above the SMA(150) and the SMA(200)
ChartMill's Evaluation of Growth
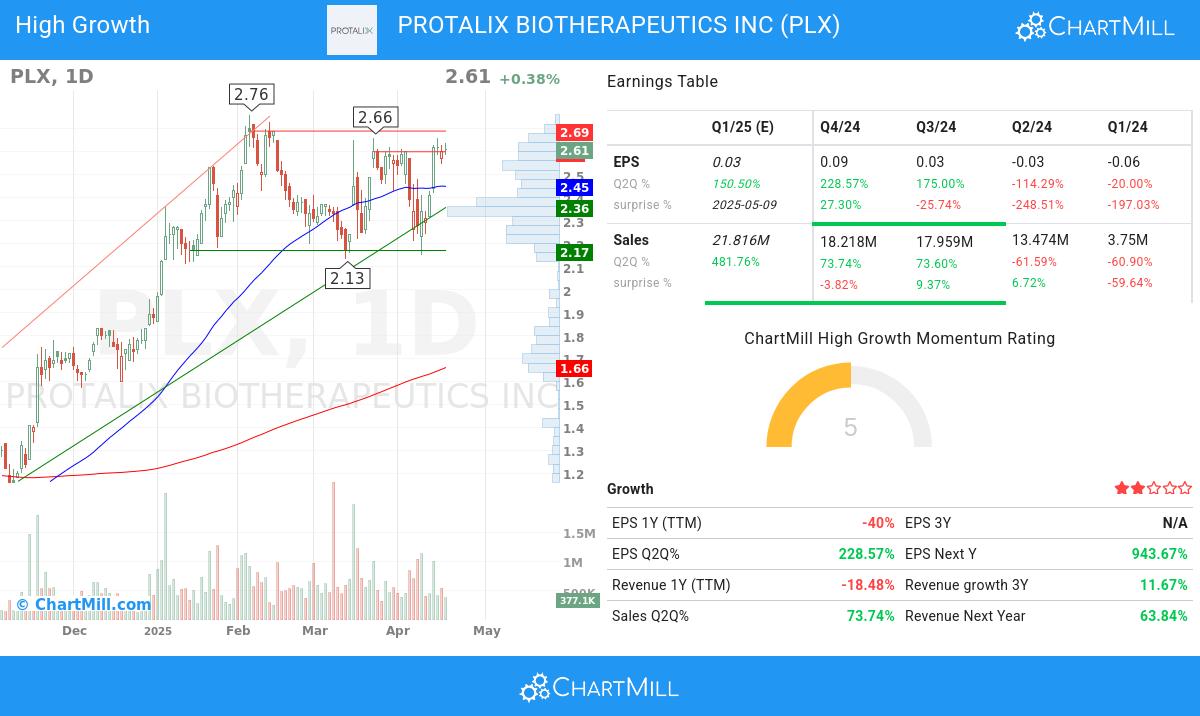
ChartMill assigns a High Growth Momentum Rating (HGM) to every stock. This score ranges from 0 to 10 and evaluates the different growth and profitability aspects, including accelleration, surprises and revisions. PLX scores a 5 out of 10:
Earnings Momentum
- With a favorable trend in its quarter-to-quarter (Q2Q) earnings per share (EPS), PLX highlights its ability to generate increasing profitability, showcasing a 229.0% growth.
- The earnings per share (EPS) growth of PLX is accelerating: the current Q2Q growth of 229.0% is above the previous quarter Q2Q growth of 175.0%. Earnings momentum and acceleration are key for high growth systems.
- Sales growth accelerated for 2 quarters in a row.
- With impressive quarter-to-quarter (Q2Q) revenue growth of 73.74%, PLX showcases its ability to generate increased sales and revenue. This growth indicates the company's strong customer demand and its effective business strategies.
- Accelerating Sales growth for PLX: the current Q2Q growth of 73.74% exceeds the previous quarter Q2Q growth of 73.6%.
- Sales acceleration happened 2 quarters in a row.
Profitability & Financial Strength
- With a favorable trend in its free cash flow (FCF) over the past year, PLX demonstrates its ability to generate robust cash flows and maintain financial stability. This growth reflects the company's focus on efficient capital allocation and cash management.
- PLX maintains a healthy Debt-to-Equity ratio of 0.0. This indicates the company's conservative capital structure and signifies its ability to effectively manage debt obligations while maintaining a strong equity position.
Strong Market Performance
- The Relative Strength (RS) of PLX has consistently been strong, with a current 97.83 rating. This indicates the stock's ability to exhibit relative price outperformance and reflects its competitive strength.
How do we evaluate the setup for PLX?
ChartMill also assign a Setup Rating to every stock. With this score it is determined to what extend the stock has been trading in a range in the recent days and weeks. This score also ranges from 0 to 10 and is updated daily. The setup score evaluates various short term technical indicators. PLX scores a 7 out of 10:
Besides having an excellent technical rating, PLX also presents a decent setup pattern. Prices have been consolidating lately and the volatility has been reduced. There is a resistance zone just above the current price starting at 2.69. Right above this resistance zone may be a good entry point. We notice that large players showed an interest for PLX in the last couple of days, which is a good sign.
Check the latest full technical report of PLX for a complete technical analysis.
Final Thoughts
It looks like PROTALIX BIOTHERAPEUTICS INC meets the Minervini criteria. More high growth momentum breakout stocks can be found in our High Growth Momentum + Trend Template screen.
Disclaimer
Important Note: The content of this article is not intended as trading advice. It is essential to perform your own analysis and exercise caution when making trading decisions. The article presents observations created by automated analysis but does not guarantee any trading or investment outcomes. Always trade responsibly and make independent judgments.