
The search for high-growth stocks often leads investors to a point between technical momentum and fundamental strength. One organized approach that connects this separation is the strategy made popular by Mark Minervini, which joins his strict Trend Template with a concentration on solid core business performance. This process tries to find companies not only in strong price uptrends but also those displaying the earnings and sales momentum that usually drive continued rallies. By sorting for stocks that fit both technical and high-growth fundamental standards, investors try to find leaders with the possibility for major price gains.
NOVAVAX INC (NASDAQ:NVAX) recently appeared from a screen made to use this exact thinking, looking for securities that fulfill Minervini's technical checklist while also holding a solid High Growth Momentum (HGM) rating.
Looking at the Technical Trend
Minervini's Trend Template is formed on a set of fixed technical conditions made to sort for stocks in established, strong uptrends. The main principles need agreement across several moving averages and price action compared to yearly highs and lows. A check of Novavax's current chart shows it passes these important technical steps:
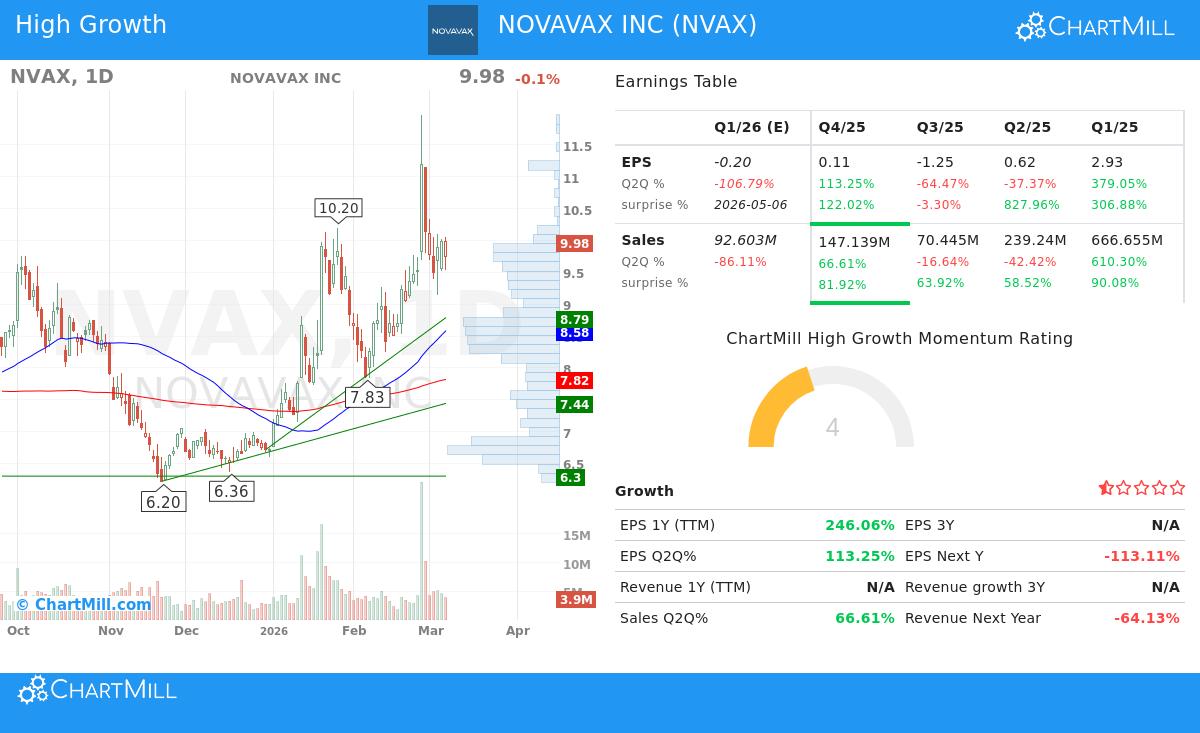
- Price Above Key Averages: The stock's last price of $9.98 trades well above its rising 50-day ($8.58), 150-day ($8.09), and 200-day ($7.82) simple moving averages (SMAs). This ordered agreement points to continued buying pressure across short, intermediate, and long-term periods.
- Moving Average Agreement: The 50-day SMA sits above both the 150-day and 200-day SMAs, while the 150-day SMA is above the 200-day SMA. This ordered positive agreement is a key feature of the Trend Template, confirming increasing momentum.
- Nearness to Highs: At $9.98, NVAX is trading within 25% of its 52-week high of $11.97, an important Minervini rule that concentrates on strength instead of low price. At the same time, the current price is about 99% above its 52-week low of $5.01, well beyond the template's need of being at least 30% above the low, which indicates a strong recovery trend.
- Better Relative Strength: With a ChartMill Relative Strength (CRS) score of 88.01, NVAX is doing better than nearly 90% of the wider market. Minervini stresses that real market leaders regularly show high relative strength, as it shows core demand and institutional interest.
This technical view puts NVAX solidly in what Minervini calls a "Stage 2" advance, the main phase where the largest gains usually happen.
Checking the Growth Driver
While a strong chart is necessary, the Minervini strategy gives similar importance to the fundamental cause moving the price action. The attached screen also needed a minimum High Growth Momentum rating, which examines a company's earnings and sales path. Novavax shows a complicated but clearly better fundamental story.
The company's most recent trailing twelve-month (TTM) earnings per share is $2.41, showing a very large year-over-year growth of 246%. This fast profit increase is a main goal for growth investors and matches Minervini's concentration on "big earnings attract[ing] big attention." Recent quarterly sales growth also showed major strength, with the last quarter reporting a 66.6% increase compared to the same time a year before.
However, a closer look shows the changeable character of biotech, especially in the post-pandemic vaccine market. While the company has passed revenue estimates in each of the last four quarters, recent analyst changes for future earnings have turned a little negative. Also, sequential quarterly earnings comparisons show variation, pointing out the need for investor examination about the continuation of growth. This mixed picture shows why the Minervini method uses such screens as a beginning for more investigation, not a final buy signal.
Technical Condition and Setup State
According to ChartMill's own analysis, NVAX gets a solid Technical Rating of 9 out of 10, confirming the clear strength seen in the Trend Template analysis. The report states both short-term and long-term trends are positive, and the stock is doing better than most of the market. Trading ease is also strong, with good average trading volume allowing simpler entry and exit.
The analysis does give a note of warning about the immediate trading setup. While the technical condition is very good, the Setup Quality score is a middle 4. The report proposes that recent price movement has been "a little bit too volatile to find a nice entry and exit point," and it may be wise to wait for a clearer consolidation pattern, like the Volatility Contraction Pattern (VCP) Minervini explains, to form. This difference is important, it names NVAX as a technically strong stock in an uptrend, but proposes the best low-risk entry point may not be here yet.
A detailed list of the support and resistance levels, volume trends, and full technical summary can be found in the complete ChartMill Technical Report for NVAX.
Locating Comparable Chances
Novavax acts as a relevant example in using a joined technical and growth momentum filter. For investors looking to scan for other stocks that currently fit similar standards of strong trending action and high-growth fundamentals, the ready-made screen is available to run.
Closing Thoughts
NOVAVAX INC shows the kind of stock a joined Minervini and growth momentum screen tries to find: a company with a technically strong chart structure confirming a major uptrend, paired with a fundamental profile showing times of fast earnings growth. The stock clearly meets the strict checklist of the Trend Template and has the high-growth traits that can act as a cause for more price movement. However, the analysis also points out the importance of timing and risk control. The current changeability suggests waiting for a more formed price consolidation could give a better risk/reward entry, following the controlled "specific entry point" thinking central to the strategy. As usual, such screens are best used as the initial stage in a complete research process.
Disclaimer: This article is for informational and educational purposes only. It is not intended as investment advice, a recommendation, or an offer to buy or sell any security. The analysis is based on data provided and certain screening methodologies, which have inherent limitations. Investors should conduct their own independent research and consider their individual financial circumstances and risk tolerance before making any investment decision. Past performance is not indicative of future results.