
In growth investing, joining a solid technical plan with detailed fundamental study can be an effective way to find possible market leaders. A method from trader Mark Minervini depends on his Specific Entry Point Analysis (SEPA) system. This process methodically sorts for stocks showing clear uptrends, better relative strength, and quickening fundamental growth. The aim is to find equities that are not just going up but are moving with the base momentum and financial soundness to indicate the rise may continue. This two-part study aids investors in concentrating on quality, aiming to take part in the early to middle parts of a stock’s strongest climbs while controlling risk with precise technical rules.
NETSTREIT CORP (NYSE:NTST) offers an interesting example for this joined method. As a Real Estate Investment Trust (REIT) centered on single-tenant, net-lease retail properties in steady sectors, its business plan is made for consistency. Recent activity indicates it is being noted for its growth path.
Technical Fit with the Minervini Trend Template
The base of the Minervini method’s technical filter is the Trend Template, a group of fixed rules made to sort for stocks in a clear and sound Stage 2 uptrend. NETSTREIT’s present chart position displays a clear fit with these rules:
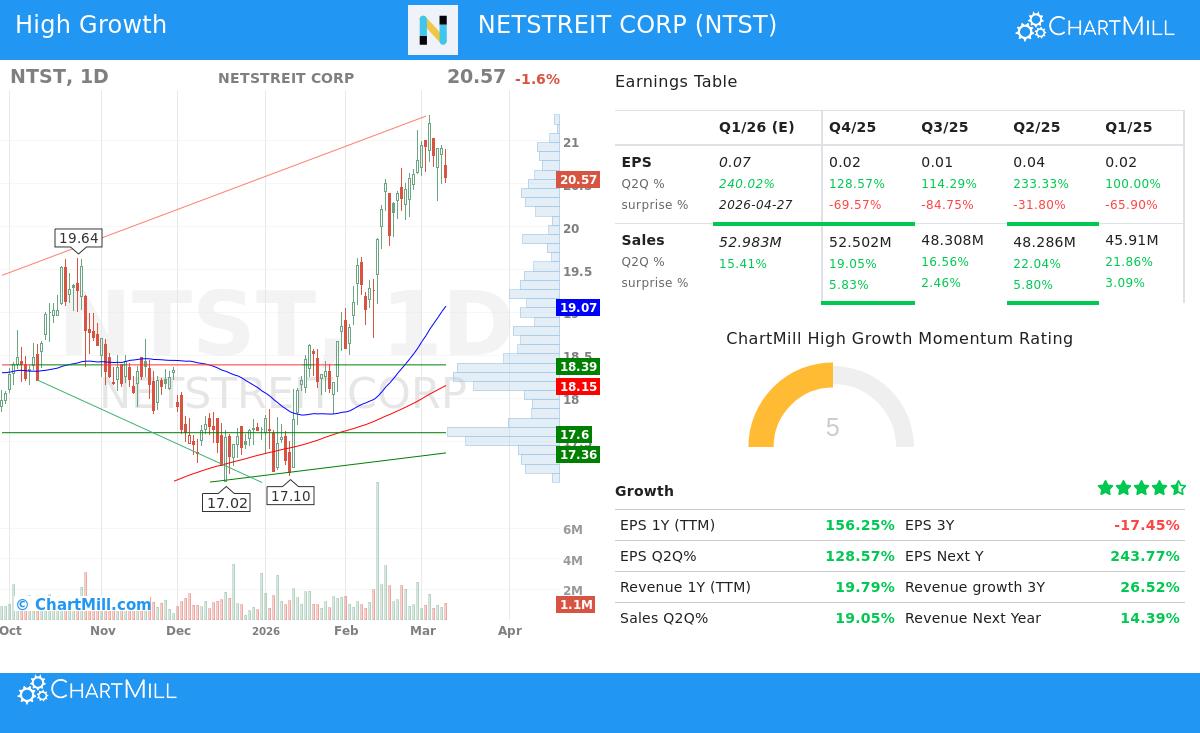
- Trending Price and Moving Averages: The stock price is above all main moving averages (50-day, 150-day, and 200-day), and these averages are in a rising order. Importantly, the 50-day moving average ($19.07) is above both the 150-day ($18.54) and 200-day ($18.15) averages, confirming the positive order across periods that Minervini notes.
- Nearness to Highs: A main idea of the method is to focus on strength. NTST is now within 4% of its 52-week high of $21.30, fitting the "within 25% of the high" rule. At the same time, its price is about 47% above its 52-week low, well past the needed 30% level. This shows the stock has notable momentum behind its move.
- Better Relative Strength: Minervini looks for market leaders. NTST has a ChartMill Relative Strength (CRS) ranking of 84.85, meaning it has done better than about 85% of the market in the last year. This high ranking directly shows the institutional interest and leader quality the method looks for.
This technical view suggests NTST is not in a scattered rally but is showing the controlled, trending price action typical of stocks being bought.
Fundamental Reasons for Strong Growth Momentum
While the Trend Template makes sure a stock is technically good, the Minervini method fully joins fundamental study to find the reason for the move. The given data points show several factors that could support NTST’s firm price activity and fit a strong-growth momentum view.
- Strong Earnings Growth: The most notable numbers are in earnings per share (EPS). Year-over-year EPS growth on a trailing twelve-month (TTM) basis is 156.25%. More interesting is the speeding up seen in recent quarterly growth rates, which have been from 100% to over 233%. This form of speeding growth is a sign of companies possibly entering a period that often draws investor attention.
- Steady Revenue Growth: Top-line growth gives the base for earnings. NTST shows firm and even revenue growth, with TTM revenue up almost 20%. Quarterly sales growth has regularly been in the mid-to-high teens and low twenties percent range, showing the expandable nature of its purchase-centered business model.
- Positive Analyst Changes: The view among analysts is getting better, a point Minervini monitors. Estimates for both next-year EPS and revenue have been moved up over the last three months by 4.6% and 7.0%, in order. This upward change pattern often comes before more institutional buying.
- Firm Industry Position: In its industry (Diversified REITs), NTST is a top performer, technically doing better than 93% of its 123 peers. This relative strength inside a sector is another check that the stock is a leader.
Technical Condition and Setup Summary
A look at the detailed ChartMill Technical Report for NTST gives a combined view. The report gives the stock a full Technical Rating of 10 out of 10, noting its steady good activity across both short and long-term periods. The long-term and short-term trends are both called positive. Also, the report notes a Setup Rating of 7, showing the stock is now in a resting phase, specifically seen as a bull flag pattern, after its recent rise. This pattern of lower movement after a strong move can sometimes come before the next rise, giving a possible chance for entry set by clear support and resistance levels, as described in the report.
Locating Like Chances
NETSTREIT CORP shows the kind of security that can appear when filtering for both strict technical trends and fundamental growth momentum. For investors looking to use this two-rule method to find other possible choices, the set screen that found NTST is ready to view. You can see the present results and plan of this 'High Growth Momentum + Trend Template' screen by using this link: Explore the High Growth Momentum & Trend Template Screen.
Disclaimer: This article is for information and learning only. It is not meant as investment guidance, a suggestion, or an offer to buy or sell any security. The study is based on given data and certain methods, but past activity does not show future outcomes. Investors should do their own complete research, think about their money situation, risk comfort, and investment goals, and talk with a qualified financial advisor before making any investment choices.