
In the field of growth investing, joining a strict technical system with attention to fundamental momentum can be an effective method for spotting possible leaders. One technique that shows this is the plan made famous by trader Mark Minervini. His method uses filters to find stocks showing solid, confirmed uptrends with his "Trend Template," while also requiring strong and improving earnings and sales growth. This two-part aim tries to find companies that are both in a positive technical state and showing the fundamental force that frequently comes before major price gains. A filter using these ideas lately found NPK International Inc (NYSE:NPKI) as a candidate for more review.
Checking the Technical Base: The Minervini Trend Template
The Minervini Trend Template is made to find stocks in a clear Stage 2 rise, making sure an investor is moving with the existing momentum. It uses a set of firm technical tests. For NPKI, the present information indicates it passes these important checks for a trending stock:
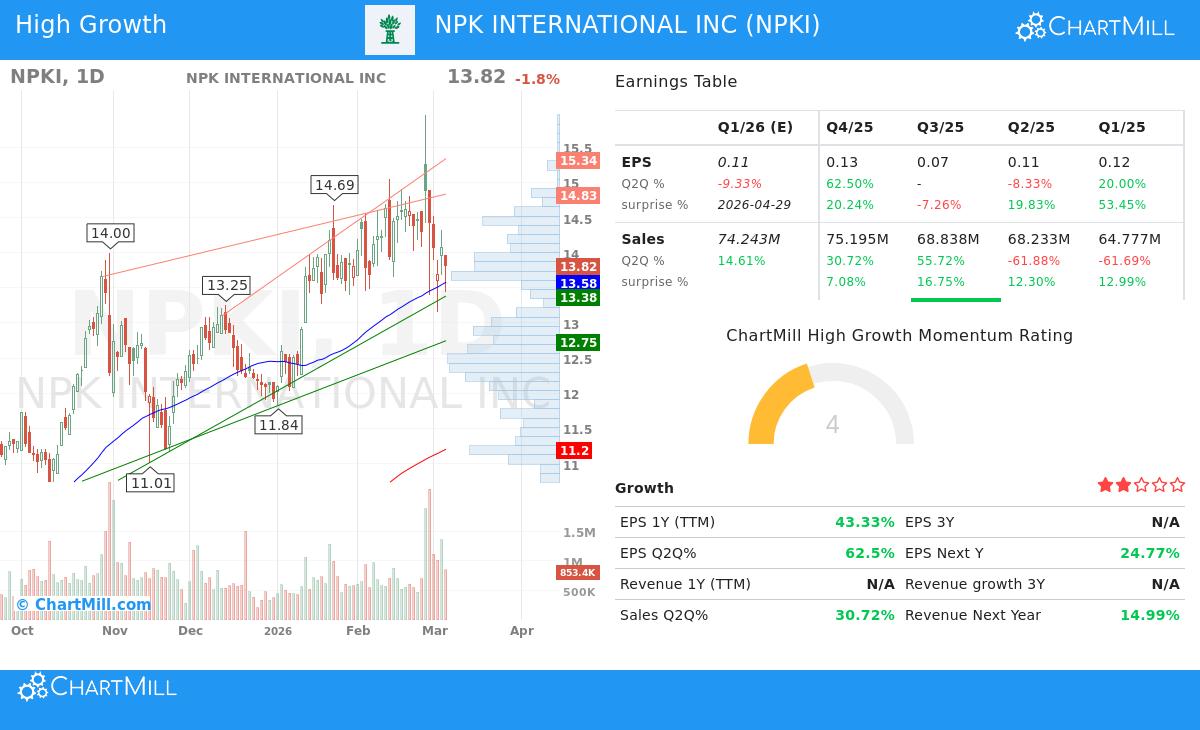
- Price Above Key Averages: The stock's last price of $13.82 trades above its rising 50-day ($13.58), 150-day ($12.11), and 200-day ($11.20) simple moving averages (SMAs). This ordered position shows continued buying interest across several time periods.
- Moving Average Order: The 50-day SMA is above both the 150-day and 200-day SMAs, and the 150-day SMA is above the 200-day SMA. This positive order of averages is a central idea of the template, confirming the force and structure of the uptrend.
- Nearness to Highs: NPKI's price is within 25% of its 52-week high of $15.96, a filter that looks at market leaders instead of deep value or turnaround situations. At the same time, the current price is more than 30% above its 52-week low of $4.76, confirming a major recovery or rise is already happening.
- Better Relative Strength: With a ChartMill Relative Strength (CRS) score of 95.2, NPKI is doing better than about 95% of the whole market. Minervini states that real leaders regularly show high relative strength, as it points to institutional buying and better performance despite wider market moves.
This technical view shows a stock in a verified long-term uptrend, trading with force, and placed as a leader, all signs the Trend Template aims to find.
Checking the Growth Driver: High Growth Momentum (HGM)
While a solid chart is necessary, the Minervini plan gives similar importance to the fundamental driver of speeding growth. The "High Growth Momentum" score tries to measure this part. For NPKI, several fundamental numbers give background for its growth picture:
- Earnings Growth Path: The company has shown large earnings ability on both a yearly and three-month basis. Trailing Twelve-Month (TTM) EPS grew over 43% year-over-year. More lately, last quarter's EPS jumped 62.5% compared to the same quarter last year.
- Sales Force: Revenue growth has been solid, with the last quarter showing a year-over-year rise of over 30%. Analyst view seems positive, with the average guess for next year's revenue changed upward by almost 5% over the past three months.
- Earnings Surprise Record: A history of exceeding guesses can be a good sign. NPKI has passed analyst EPS guesses in three of the past four quarters, with an average beat of over 17%.
- Sector Position: Inside the Trading Companies & Distributors industry, NPKI's technical force is significant, doing better than 97% of its peers. This fits the Minervini idea of focusing on sector leaders, which often have the strongest fundamentals and investor attention.
It is necessary to see that not all growth numbers are completely positive. The most recent quarter showed a drop in profit margin compared to the earlier quarter, and free cash flow has fallen notably over the past year. These are points a full study would balance with the solid top-line and bottom-line growth numbers.
Technical Analysis Overview
ChartMill's separate technical report gives a combined view, giving NPKI a top-level technical score of 10 out of 10. The report states the stock's steady results across time periods and its constant better performance versus the wider market. The long-term trend is called positive, though the short-term trend is now neutral, indicating a time of pause inside the larger rise.
The study finds several close support areas, the nearest ranging from $13.38 to $13.73, made by a mix of trendlines and moving averages. A main resistance level is stated at $14.90. The report also notes that the stock has been trading in a wide band over the past month and is now near the lower part of that band, with higher recent volume, a detail for investors to watch.
For a full look at the support, resistance, and trade setup study, you can see the complete ChartMill Technical Report for NPKI.
Closing
NPK International Inc shows an example of a stock that passes a methodical filter built on growth and momentum ideas. It shows the standard technical marks of a Minervini-style trend candidate, with price solidly above ordered moving averages and outstanding relative strength. Fundamentally, it shows signs of high growth momentum, especially in recent earnings and sales increases, though with some varied signals on profit and cash flow. As with any investment plan, the first filter is a beginning for more detailed research, not a final answer. The meeting of a solid technical state with fundamental growth speed, however, is exactly what plans like Minervini's are made to find.
Want to look at other stocks that pass similar checks for solid trends and high growth momentum? You can use the filter yourself with this link: High Growth Momentum + Trend Template Screen.
Disclaimer: This article is for information and learning only. It is not meant as investment guidance, a suggestion, or a plan to buy or sell any security. The study is based on given information and certain techniques, which have limits. You should do your own research, think about your money situation, and talk with a qualified financial advisor before making any investment choices. Past results do not show future outcomes.