
The method used to find possible investment choices joins a strict technical system with attention to fundamental growth momentum. This method is guided by the ideas of Mark Minervini, a two-time U.S. Investing Champion, whose plan focuses on purchasing stocks that are already in clear upward moves and are supported by improving business basics. The procedure uses a two-step filter: first, it uses the Minervini Trend Template to sort for securities showing clear, organized price trends. Second, it adds a High Growth Momentum (HGM) rating to make sure the company shows the type of strong earnings and sales growth that usually supports continued price gains. This two-part study tries to locate leading companies early in their growth periods, where technical health and fundamental betterment meet.
A Clear Trend Template Example
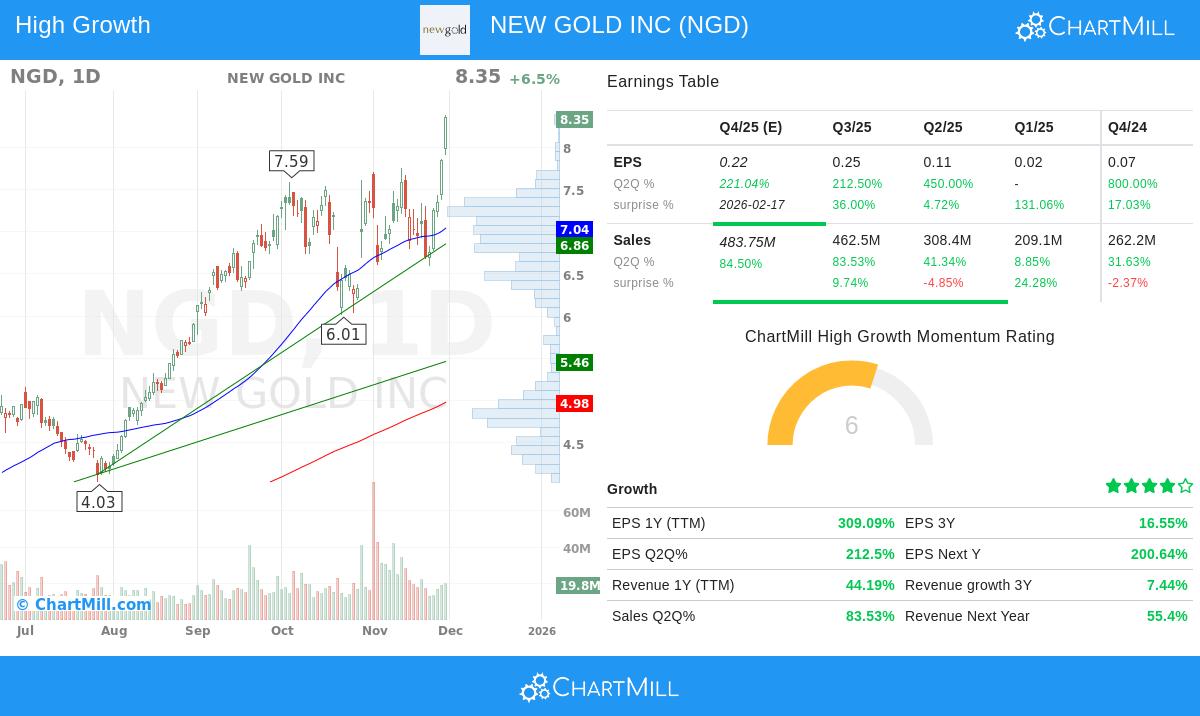
NEW GOLD INC (NYSEARCA:NGD) shows a strong example of a stock that fits the exact technical requirements of the Minervini Trend Template. This template is made to find stocks in a confirmed Stage 2 upward move, where the chance of continued gains is statistically greater. A look at NGD's chart and main numbers shows a close fit with the template's rules:
- Moving Average Arrangement: The stock's present price ($8.35) trades well above its rising 50-day ($7.04), 150-day ($5.57), and 200-day ($4.98) simple moving averages (SMAs). Importantly, the 50-day SMA is above the 150-day SMA, which is above the 200-day SMA, forming the "stacked" order that shows a clear, steady uptrend across several time periods.
- Nearness to Highs: NGD is trading within 0.4% of its 52-week high of $8.38, meeting the template's need to be within 25% of the high. At the same time, the present price is over 240% above its 52-week low ($2.43), well past the 30% limit. This shows clear momentum and a full change from a resting phase to a leading phase.
- Strong Relative Performance: With a ChartMill Relative Strength (CRS) score of 97.67, NGD is doing better than nearly 98% of all stocks in the market. This high relative performance is a key part of the Minervini idea, as it finds market leaders that draw institutional money. Also, it does better than 84% of its group in the Metals & Mining industry, confirming it leads its sector.
This technical view is not random; it shows continued buying pressure and a change in market view. The Trend Template works as a quality filter, making sure an investor only looks at stocks where the trend is clearly favorable.
The Fundamental Driver: High Growth Momentum
While a healthy chart is necessary, Minervini's plan gives similar importance to the fundamental reason pushing the price movement. The High Growth Momentum rating checks if a company's financial results are improving, a main feature of stocks before they make their biggest moves. NGD's recent financial reports show the signs of such a momentum change.
The company has shown clear betterment in profitability and operational results:
- Strong Earnings Growth: Earnings per Share (EPS) for the trailing twelve months (TTM) is $0.45, showing a year-over-year growth of 309%. Recent quarterly comparisons are more notable, with the last quarter showing EPS growth of 212% compared to the same quarter last year, and the quarter before that growing by 450%.
- Steady Earnings Beats: A key sign of inner health is when a company regularly beats analyst predictions. NGD has exceeded EPS estimates in each of the last four quarters, with an average beat of 47.2%. This series of positive beats often leads analysts to increase future estimates, creating a cycle of rising expectations and price finding.
- Healthy Revenue and Margin Growth: Top-line growth is also improving, with revenue for the last quarter up 83.5% year-over-year. Maybe more importantly, this sales growth is turning efficiently into profits. The profit margin in the most recent quarter grew to 30.8%, up notably from 22.2% in the prior quarter and 21.0% two quarters before. This growth in profitability points to operational efficiency and pricing ability.
- Positive Analyst Changes: Reflecting the better outlook, analysts have increased their estimates for NGD. The average EPS estimate for the next year has been raised by 7.05% over the last three months, while revenue estimates have been raised by 4.15%. Upward changes are a strong secondary driver, as they push institutional models to revalue the stock.
This mix of improving earnings, growing margins, and positive estimate changes gives the fundamental "support" that can maintain a technical breakout. It shifts the investment idea past simple guess on commodity prices and toward seeing a company-specific operational recovery.
Technical Condition and Present Situation
A look at the ChartMill Technical Report for NGD gives a combined view. The report gives NGD a full technical rating of 10 out of 10, noting its clear positive trends across all time periods, leadership in the market (97th percentile), and status as a 52-week high maker. The long-term and short-term trends are both rated as positive, confirming the stock is in a definite Stage 2 upward move.
However, the report also gives a note of care related to entry timing. While the technical condition is very good, the setup quality rating is presently low (2 out of 10). The summary states that "prices have been rising strongly lately" and proposes that "for a good entry it is better to wait for a pause." This fits with careful trading practice; even the healthiest stocks rarely move straight up without pause. The Minervini plan focuses on specific, lower-risk entry points, often after a period of reduced price movement. For NGD, investors may want to watch the stock for a possible move back to key support areas, like the zone between $6.85 and $6.86 where several moving averages and trendlines meet, to start a position with a better risk/reward balance.
Locating Comparable Possibilities
The study of NEW GOLD INC shows the effectiveness of joining trend-following technicals with fundamental growth momentum filtering. For investors looking to use this method to find other possible choices, the preset filter used to locate NGD is ready for more study.
You can find more stocks that meet this "High Growth Momentum + Trend Template" criteria by exploring the predefined screen on ChartMill.
Disclaimer: This article is for informational and educational purposes only. It is not a recommendation to buy or sell any security. The analysis is based on data provided and certain methodologies, and past performance is not indicative of future results. All investing involves risk, including the potential loss of principal. You should conduct your own research and consult with a qualified financial advisor before making any investment decisions. Please read our full disclaimer here.