
For investors who use technical analysis to find possible trades, the search usually starts with two basic questions: which stock is in a solid trend, and when is the correct time to purchase it? A methodical way to answer these questions includes scanning for stocks that show both good technical condition and a constructive price consolidation pattern, hinting at a possible breakout. This process sorts for securities with high proprietary ratings for their total technical condition and the state of their present pattern, trying to find chances where a solid trend is resting before its next move up.
MERCK & CO. INC. (NYSE:MRK) recently appeared from such a scan, presenting a noteworthy case for technical investors. The pharmaceutical company's chart shows a mix of solid basic momentum and a recent tightening in price action, a typical sign before a possible new advance.
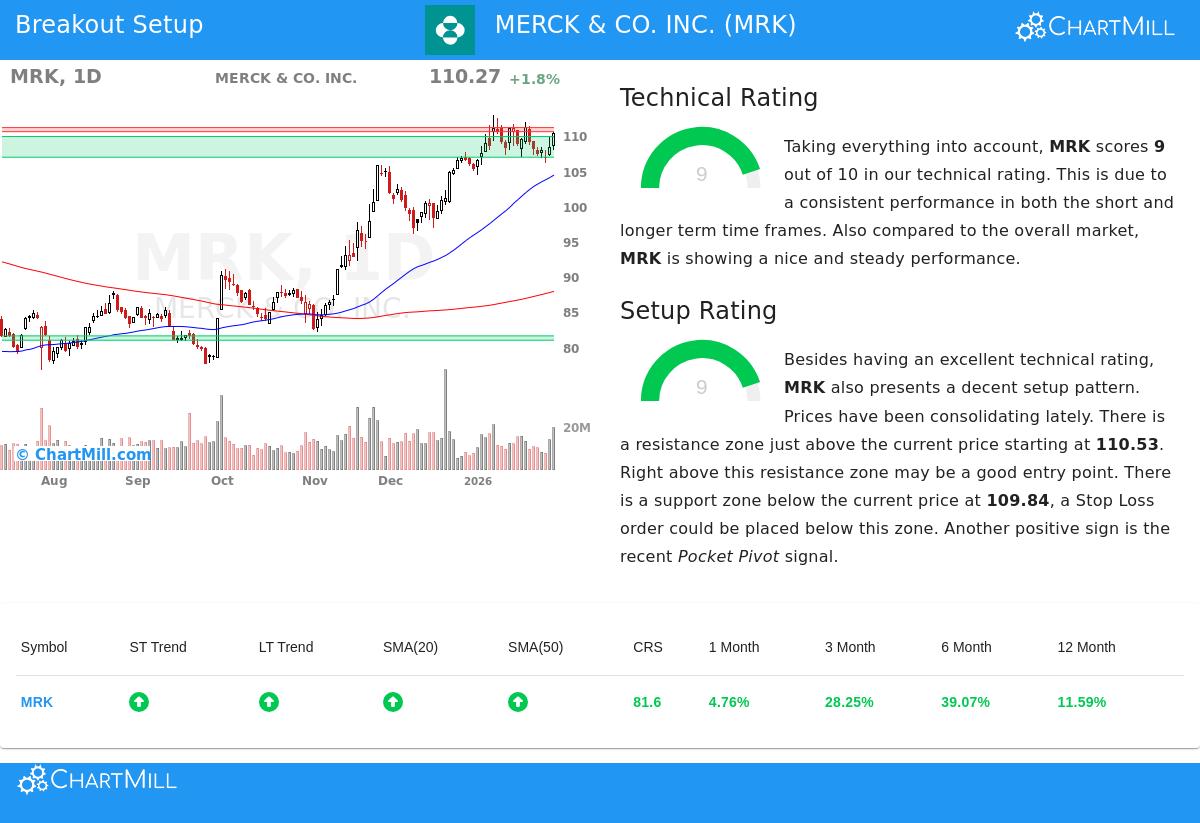
A Base of Technical Condition
The first part of this breakout method is finding stocks with better technical condition, as a solid basic trend raises the chance that a breakout will continue. Merck’s technical picture is very firm, getting a high rating of 9 out of 10 in the ChartMill Technical Analysis report. This rating is formed on a base of steady positive momentum across all important time periods.
Important technical good points for Merck include:
- Two Positive Trends: Both the short-term and long-term trends for MRK are rated as positive, showing aligned bullish momentum from daily charts to weekly and monthly views.
- Solid Moving Average Agreement: The stock is trading above all its main simple moving averages (20, 50, 100, and 200-day), and each of these averages is itself in a rising formation. This layered agreement is a sign of a good uptrend.
- Close to 52-Week Highs: MRK is now trading just below its 52-week high of $112.90. While the wider S&P 500 is also near highs, Merck's performance stays in line with the market leader, not falling behind it.
This firm technical background is key because it hints the stock is under steady buying and is a market leader. A breakout from a stock already showing such condition is usually seen as more dependable than one coming from a basing pattern in a weak stock.
A Good Pattern for Entry
A solid trend by itself is not a buy signal; entering after a sharp, long rise can be risky. The second key filter is the pattern quality, which finds times of consolidation or "tight" price action inside the wider uptrend. This consolidation forms a new base of support and gives a clearer, lower-risk entry point. Merck does well here too, having a Setup Quality rating of 9.
The present chart pattern shows Merck has been trading in a set range over the past month, between about $104.43 and $112.90. Recently, the price action has tightened near the middle-to-upper part of this range, showing a drop in volatility and a balance between buyers and sellers. The analysis finds a clear resistance zone just above the present price, from $110.53 to $111.11. A clear move above this zone could signal the end of the consolidation and the start of the next upward part.
Backing this pattern are several constructive parts:
- Set Support and Resistance: The technical report lists multiple support levels below, with the nearest important zone between $106.90 and $109.84, giving a logical area for a protective stop-loss order.
- Recent Buying Signal: The report notes a recent "Pocket Pivot" signal, a price/volume pattern that often shows institutional buying during a consolidation phase, adding a layer of confirmation to the pattern.
A Possible Trading Plan
Based on this study of technical condition and pattern quality, a specific trading plan appears. The idea follows the breakout method: enter on a confirmed move above resistance, with risk controlled below nearby support.
- Possible Entry: A buy stop order could be placed at $111.12, just above the found resistance zone, waiting for the stock to show it can break through.
- Possible Exit/Stop-Loss: A stop-loss order could be set at $106.89, just below the main support zone. This would limit the example loss on the trade to about 3.8%.
- Risk Setting: This set risk, combined with the stock's solid technical rating and the wider market's positive short-term trend, presents a situation where the possible gain justifies the controlled risk.
It is important to recall that this is an example case created from a technical scan. The scan's goal is to effectively reduce the list of stocks to a short group of high-chance choices for more review.
For investors looking for more chances that meet these strict rules of solid trends and good patterns, new results from the Technical Breakout Setups scan can be seen daily via this link.
,
Disclaimer: This article is for information only and does not form investment advice, a suggestion, or an offer or request to buy or sell any securities. The trading pattern described is automatically created and for example purposes. All investing and trading includes risk, including the possible loss of principal. Always do your own study, think about your financial position and risk comfort, and talk with a qualified financial advisor before making any investment choices. Past results are not a sign of future results.