
For investors who use charts and price action to guide their choices, the search for good prospects often means finding stocks that are both technically sound and ready for a possible price change. One methodical way to do this is scanning for technical breakout patterns, which uses two main proprietary measures: the ChartMill Technical Rating and the ChartMill Setup Quality Rating. The Technical Rating, a number from 0 to 10, judges the general condition and direction of a stock, with higher numbers pointing to solid upward trends. The separate Setup Quality Rating, also from 0 to 10, judges if the stock's present price formation gives a good, lower-risk chance to enter, usually marked by a period of sideways movement. By selecting for stocks with high numbers in both areas, traders try to find leading stocks that are pausing before their next possible rise.
A recent scan using this method has pointed to Magna International Inc (NYSE:MGA) as a candidate deserving more attention from a technical view. As a large worldwide automotive supplier, Magna's fundamental story is connected to the wider vehicle industry, but its recent price action indicates it may be preparing for a technical change.
Looking at the Technical Base
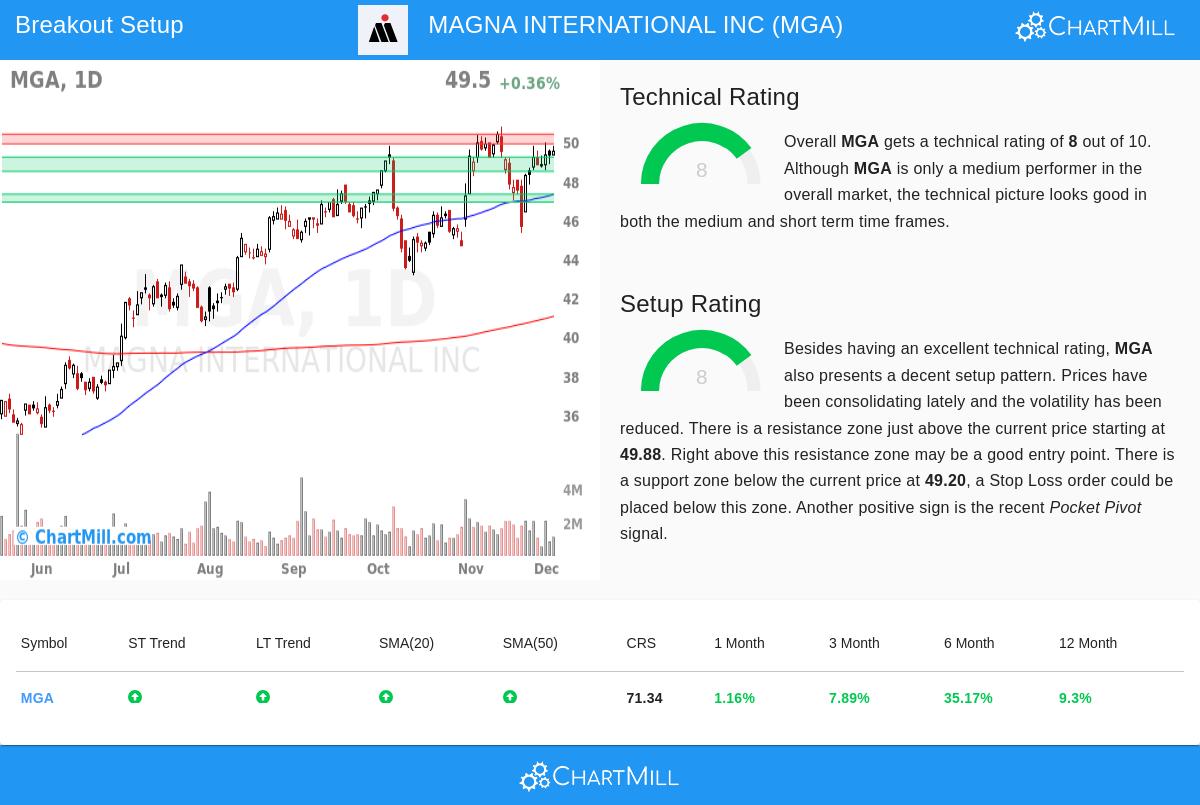
The main filter in a breakout scan looks for stocks with a good basic trend, and Magna's ChartMill Technical Rating of 8 out of 10 confirms a positive setting. This rating brings together multiple time periods and indicators to measure momentum and relative performance. A close look at the full technical report shows the parts holding up this number:
- Trend Agreement: Both the long-term and short-term trends for MGA are scored as positive. This agreement across time periods is a standard trait of a sound uptrend and lessens the disagreement that can happen when trends move against each other.
- Place Compared to Important Marks: The stock is now trading close to its 52-week high. While the wider market is also near highs, MGA's capacity to hold this level shows it is joining in the market's good performance, not falling behind.
- Moving Average Backing: The stock's price is above all its main simple moving averages (20, 50, 100, and 200-day), and each of these averages is itself in an upward pattern. This layered, positive arrangement of moving averages frequently works as a changing support framework.
This mix of factors, strong trends, nearness to highs, and moving average backing, is exactly what the Technical Rating tries to measure. A high number here answers the first important question for a technical trader: Is this a stock in a clear uptrend? For MGA, the information points to yes.
Judging the Setup Quality
A solid trend by itself is not a sign to buy; entering after a fast rise holds notable chance of a quick decline. This is where the Setup Quality Rating becomes important. It finds times of sideways or "narrow" trading, which can come before a new upward step. Magna's Setup Rating of 8 indicates it is in such a period.
The technical report gives the details for this high setup number:
- Sideways Movement Pattern: Over the last month, MGA has traded in a band between about $45.33 and $50.77. Importantly, the report says that "prices have been moving sideways recently and the price movement has been smaller." This narrowing in movement within an uptrend is often seen as a winding-up action, storing force for the next directional change.
- Clear Support and Resistance: The analysis finds specific, close technical levels. A support area is seen between $48.47 and $49.20, made from a mix of moving averages and trendlines. Just above the present price, a resistance area exists between $49.88 and $50.38.
- Supportive Signs: The report also mentions a recent "Pocket Pivot" sign, a volume-based pattern that can point to buying by large investors during a sideways period, adding another piece of confirmation to the setup.
This organized setting, with price tightening between clear support and resistance, is what the Setup Quality Rating tries to point out. It answers the second key question: Is there a reasonable, lower-chance point to think about an entry? The defined levels allow for exact trade planning, with a possible breakout entry above resistance and a protective stop-loss order set below the support area.
A Candidate for Watchlists
For technical investors, Magna International shows a chart that fits the two needs of a breakout scanning plan: clear trend strength paired with a good, usable price formation. The high Technical and Setup numbers clearly describe these states. The immediate test for the stock is the resistance area just above $49.88; a strong move above this zone on volume could be seen as the starting event the setup has been forming for. On the other hand, the multi-level support areas below give a plan for handling risk.
Interested in seeing other stocks now showing similar technical signs? You can run the live Technical Breakout Setups scan yourself here.
Disclaimer: This article is for informational purposes only and does not constitute investment advice, a recommendation, or an offer or solicitation to buy or sell any securities. The analysis is based on technical metrics and historical price action, which are not guarantees of future performance. Always conduct your own research and consider your financial situation and risk tolerance before making any investment decisions.