
For investors who use charts and price action to guide their choices, a methodical way to spot possible trades is important. One such technique looks for stocks that are both technically sound and making a constructive pattern, a pairing that can point to a possible breakout. This method centers on two main proprietary metrics from ChartMill: the Technical Rating, which judges the general condition and direction of a stock, and the Setup Quality Rating, which measures how tight and organized a stock's recent price consolidation has been. The aim is to find stocks with a high Technical Rating (showing a sound existing uptrend) that also have a high Setup Quality Rating (implying the stock is moving within a narrow band, possibly set for its next move higher). MDU RESOURCES GROUP INC (NYSE:MDU) recently appeared from such a scan, offering a profile that technical investors may find interesting.
Technical Strength: A Base of Momentum
The first part of this breakout method is finding stocks with sound technical bases. A high Technical Rating implies a stock is in a clear uptrend across several timeframes, doing better than similar stocks, and showing force compared to important moving averages. This is important because it raises the chance that any breakout from a consolidation will keep going in the direction of the existing trend.
MDU Resources gets a nearly perfect Technical Rating of 9 out of 10, putting it with the market's better performers from a technical view. The detailed technical report notes several points that add to this high score:
- Trend Alignment: Both the long-term and short-term trends for MDU are seen as positive, a matched bullish sign that gives a good push.
- Relative Performance: The stock is doing better than 76% of all stocks in the market over the last year and is in the higher group of its Gas Utilities industry, beating 71% of similar companies. This shows continued momentum.
- Price Position: MDU is trading close to its 52-week high, a typical trait of a stock in a solid uptrend. The report states this performance matches the wider market, not just because of it.
- Moving Average Support: The stock's price is above all its main simple moving averages (20, 50, 100, and 200-day), and each of these averages is itself in a rising pattern. This makes a layered support structure under the current price.
Setup Quality: The Tightening Before the Move
A sound trend by itself is not a buy signal; entering a stock that has already made a big, long move can be risky. The second part, the Setup Quality Rating, deals with this by finding times of consolidation or "tight" trading. A high score here means the stock is forming a base, with less volatility and clear support levels, which allows for a defined, lower-risk entry point if a breakout happens.
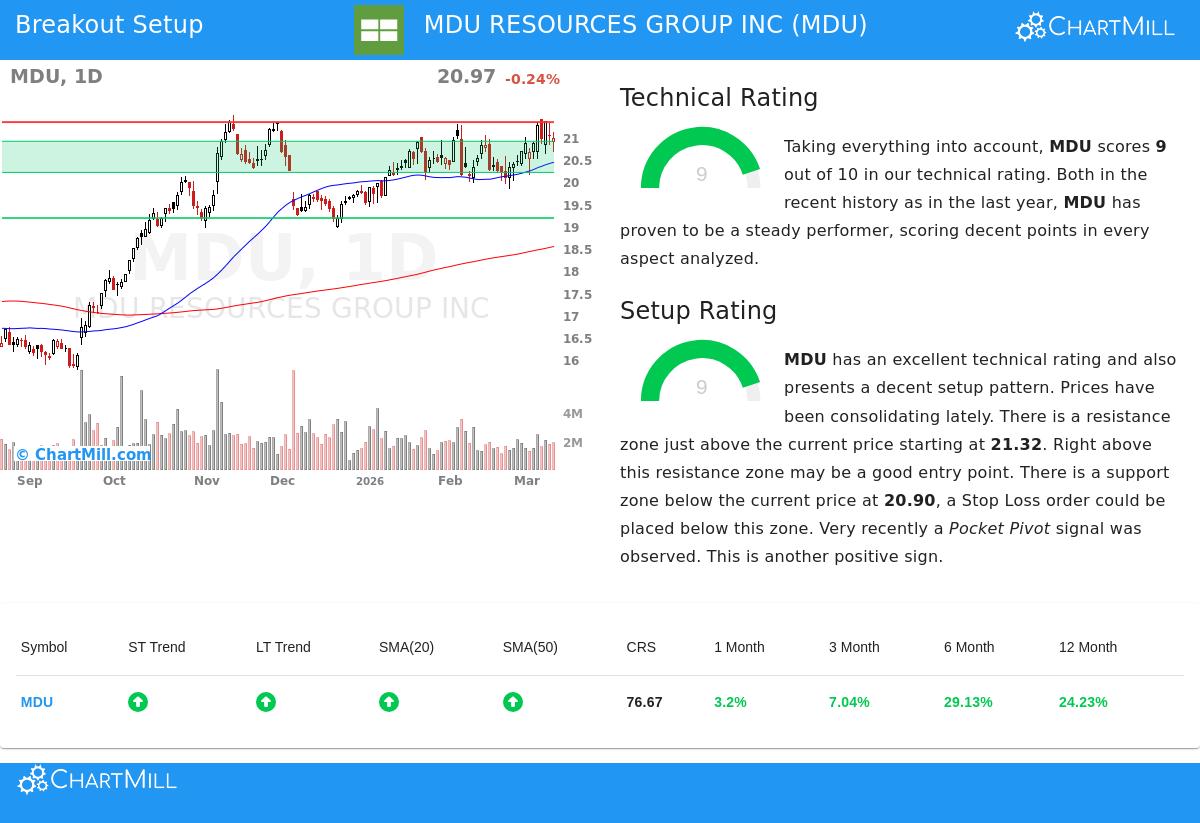
MDU Resources also does well here, with a Setup Quality Rating of 9. The analysis shows a stock that has been consolidating its recent gains, preparing for a possible new rise. Important parts of the setup include:
- Consolidation Range: Over the last month, MDU has traded between $19.82 and $21.39. It is now placed in the middle of this range, having moved back from the recent high, which can give a more acceptable risk/reward view.
- Defined Support and Resistance: The technical analysis finds a clear support area between $20.20 and $20.90, made by a mix of trendlines and moving averages. Just above the current price sits a defined resistance area around $21.32 to $21.34.
- Pocket Pivot Signal: A notable bullish signal stated in the report is a recent "Pocket Pivot," a pattern where the stock rises on volume greater than any down volume day in the earlier period. This can point to accumulation by large investors.
A Possible Breakout Situation
Joining these two high ratings makes a specific trading idea. The technical report proposes a possible breakout setup where a move above the $21.32-$21.34 resistance area could act as a trigger for entry, with a stop-loss order placed below the identified support area near $20.19. This structure gives a measurable risk limit, an important part for careful technical trading.
Finding Other Chances
The pairing of a sound trend and a good-quality setup is what makes MDU notable for technical investors using this approach. For traders looking for similar chances, using the Technical Breakout Setups screen daily can give a selected list of stocks that meet these strict conditions, sorting the market for the most promising technical patterns.
Disclaimer: This article is for information only and is not investment advice, a suggestion, or an offer or request to buy or sell any securities. The analysis is based on technical metrics and past data, which are not promises of future results. Always do your own research, think about your money situation and risk comfort, and talk with a qualified financial advisor before making any investment choices. The example trade setup is made automatically to show how it works and has a risk of loss.